
Lifco AB (publ) (LIFCO-B.ST) — 24 May 2026 Technical & Rank Read: Bullish Bias, Neutral Blend Requires Confirmation
Lifco AB (publ) (LIFCO-B.ST) screens as a high-ranking name in KGNAI’s European universe, with strength that is most pronounced on multi-month horizons while the blended technical layer remains more cautious. The rank stack (daily through 6-month) points to persistent relative leadership, but the internal technical composite highlights a key nuance: a Bullish 18-signal confluence is being tempered by a Neutral AI technical rank layer. Momentum readings are elevated—RSI is strongly positive and MACD histogram is positive—yet volatility is not expanding meaningfully, with Bollinger bandwidth near 0.0932. From a market-structure perspective, this is a “trend intact, timing sensitive” configuration where continuation ideally requires confirmation above the identified resistance zone, while a failure below support would raise the probability of a regime cooling rather than a full reversal.
- Rank stance: Short / Mid / Long = Bullish (leadership persists across timeframes)
- Technical confluence label: Bullish (18-signal score 0.389), but overall blended remains Neutral (0.235)
- Key levels: Support ~ 276.1600 | Resistance ~ 316.5000
- News sentiment bias: Neutral on average (0.024), while the normalized sentiment score is 0.99 (Bullish)
- Confirmation / invalidation: A sustained break above 316.5000 with volume supports continuation; a close below 276.1600 increases deterioration risk
KGNAI evaluates assets using large cross-sectional datasets built from millions of structured data points. Inputs incorporate fundamental metrics, technical structures, and systematically processed news sentiment. Statistical models, machine learning, and AI frameworks are used to assess relative positioning, signal alignment, and probabilistic behavior across broad universes.
- Ranks are comparative across the tracked universe, not absolute price targets.
- Confluence reflects alignment among independent signal groups.
- Support/resistance levels are probabilistic decision zones, not guarantees.
- Sentiment provides contextual bias within the broader analytical framework.
KGNAI Signal + Technical Snapshot + News Sentiment Digest
As of: 24-May-2026
Ticker: LIFCO-B.ST
1) KGNAI AI Analysis
Region: EUROPE
Total universe size: 1415 ranked instruments
- Daily rank: #29 out of 1415 — Bullish
- Weekly rank: #14 out of 1415 — Bullish
- Monthly rank: #72 out of 1415 — Bullish
- 3-Monthly rank: #4 out of 1415 — Bullish
- 6-Monthly rank: #6 out of 1415 — Bullish
- Yearly rank: #40 out of 1415 — Bullish
The rank profile is unusually consistent: LIFCO-B.ST remains in the upper tier across the full stack, including #29 daily and #14 weekly (short-horizon strength), while the #4 3-month and #6 6-month readings place it firmly in the top decile of the 1415-instrument universe. This cross-horizon agreement matters because it reduces the probability that the signal is a single-window artifact; instead, it suggests the market has been rewarding the name persistently in relative terms.
The one mild tension is the distance between the monthly rank (#72) and the stronger multi-month ranks. Rather than reading that as a reversal signal, it is more consistent with a “catch-up” dynamic: intermediate performance can lag even when longer-horizon strength remains dominant, particularly when the tape becomes more selective. The yearly rank (#40) reinforces that the longer-run posture is constructive without implying uninterrupted smoothness.
The stated term view is Bullish across short-, mid-, and long-term horizons. In a ranking framework, that does not require linear upside; it indicates a statistically stronger behavioral profile versus peers, conditioned on the same universe and methodology. The key analytical question for the next stage is not whether the instrument has ranked well, but whether the technical layer (Sections 2–5) confirms a continuation regime versus a late-stage momentum plateau.
KGNAI ranks each instrument across large universes using multiple proprietary AI tests and statistical models (millions of data points). Lower ranks generally indicate stronger probability of favorable performance behavior, while higher ranks indicate weaker probability and more bearish positioning.
Term view: Short-term: Bullish. Mid-term: Bullish. Long-term: Bullish.
Want the full universe and complete rank tables? Unlock full access on KGNAI: https://www.kgnai.com/pricing
2) Price & trend overview
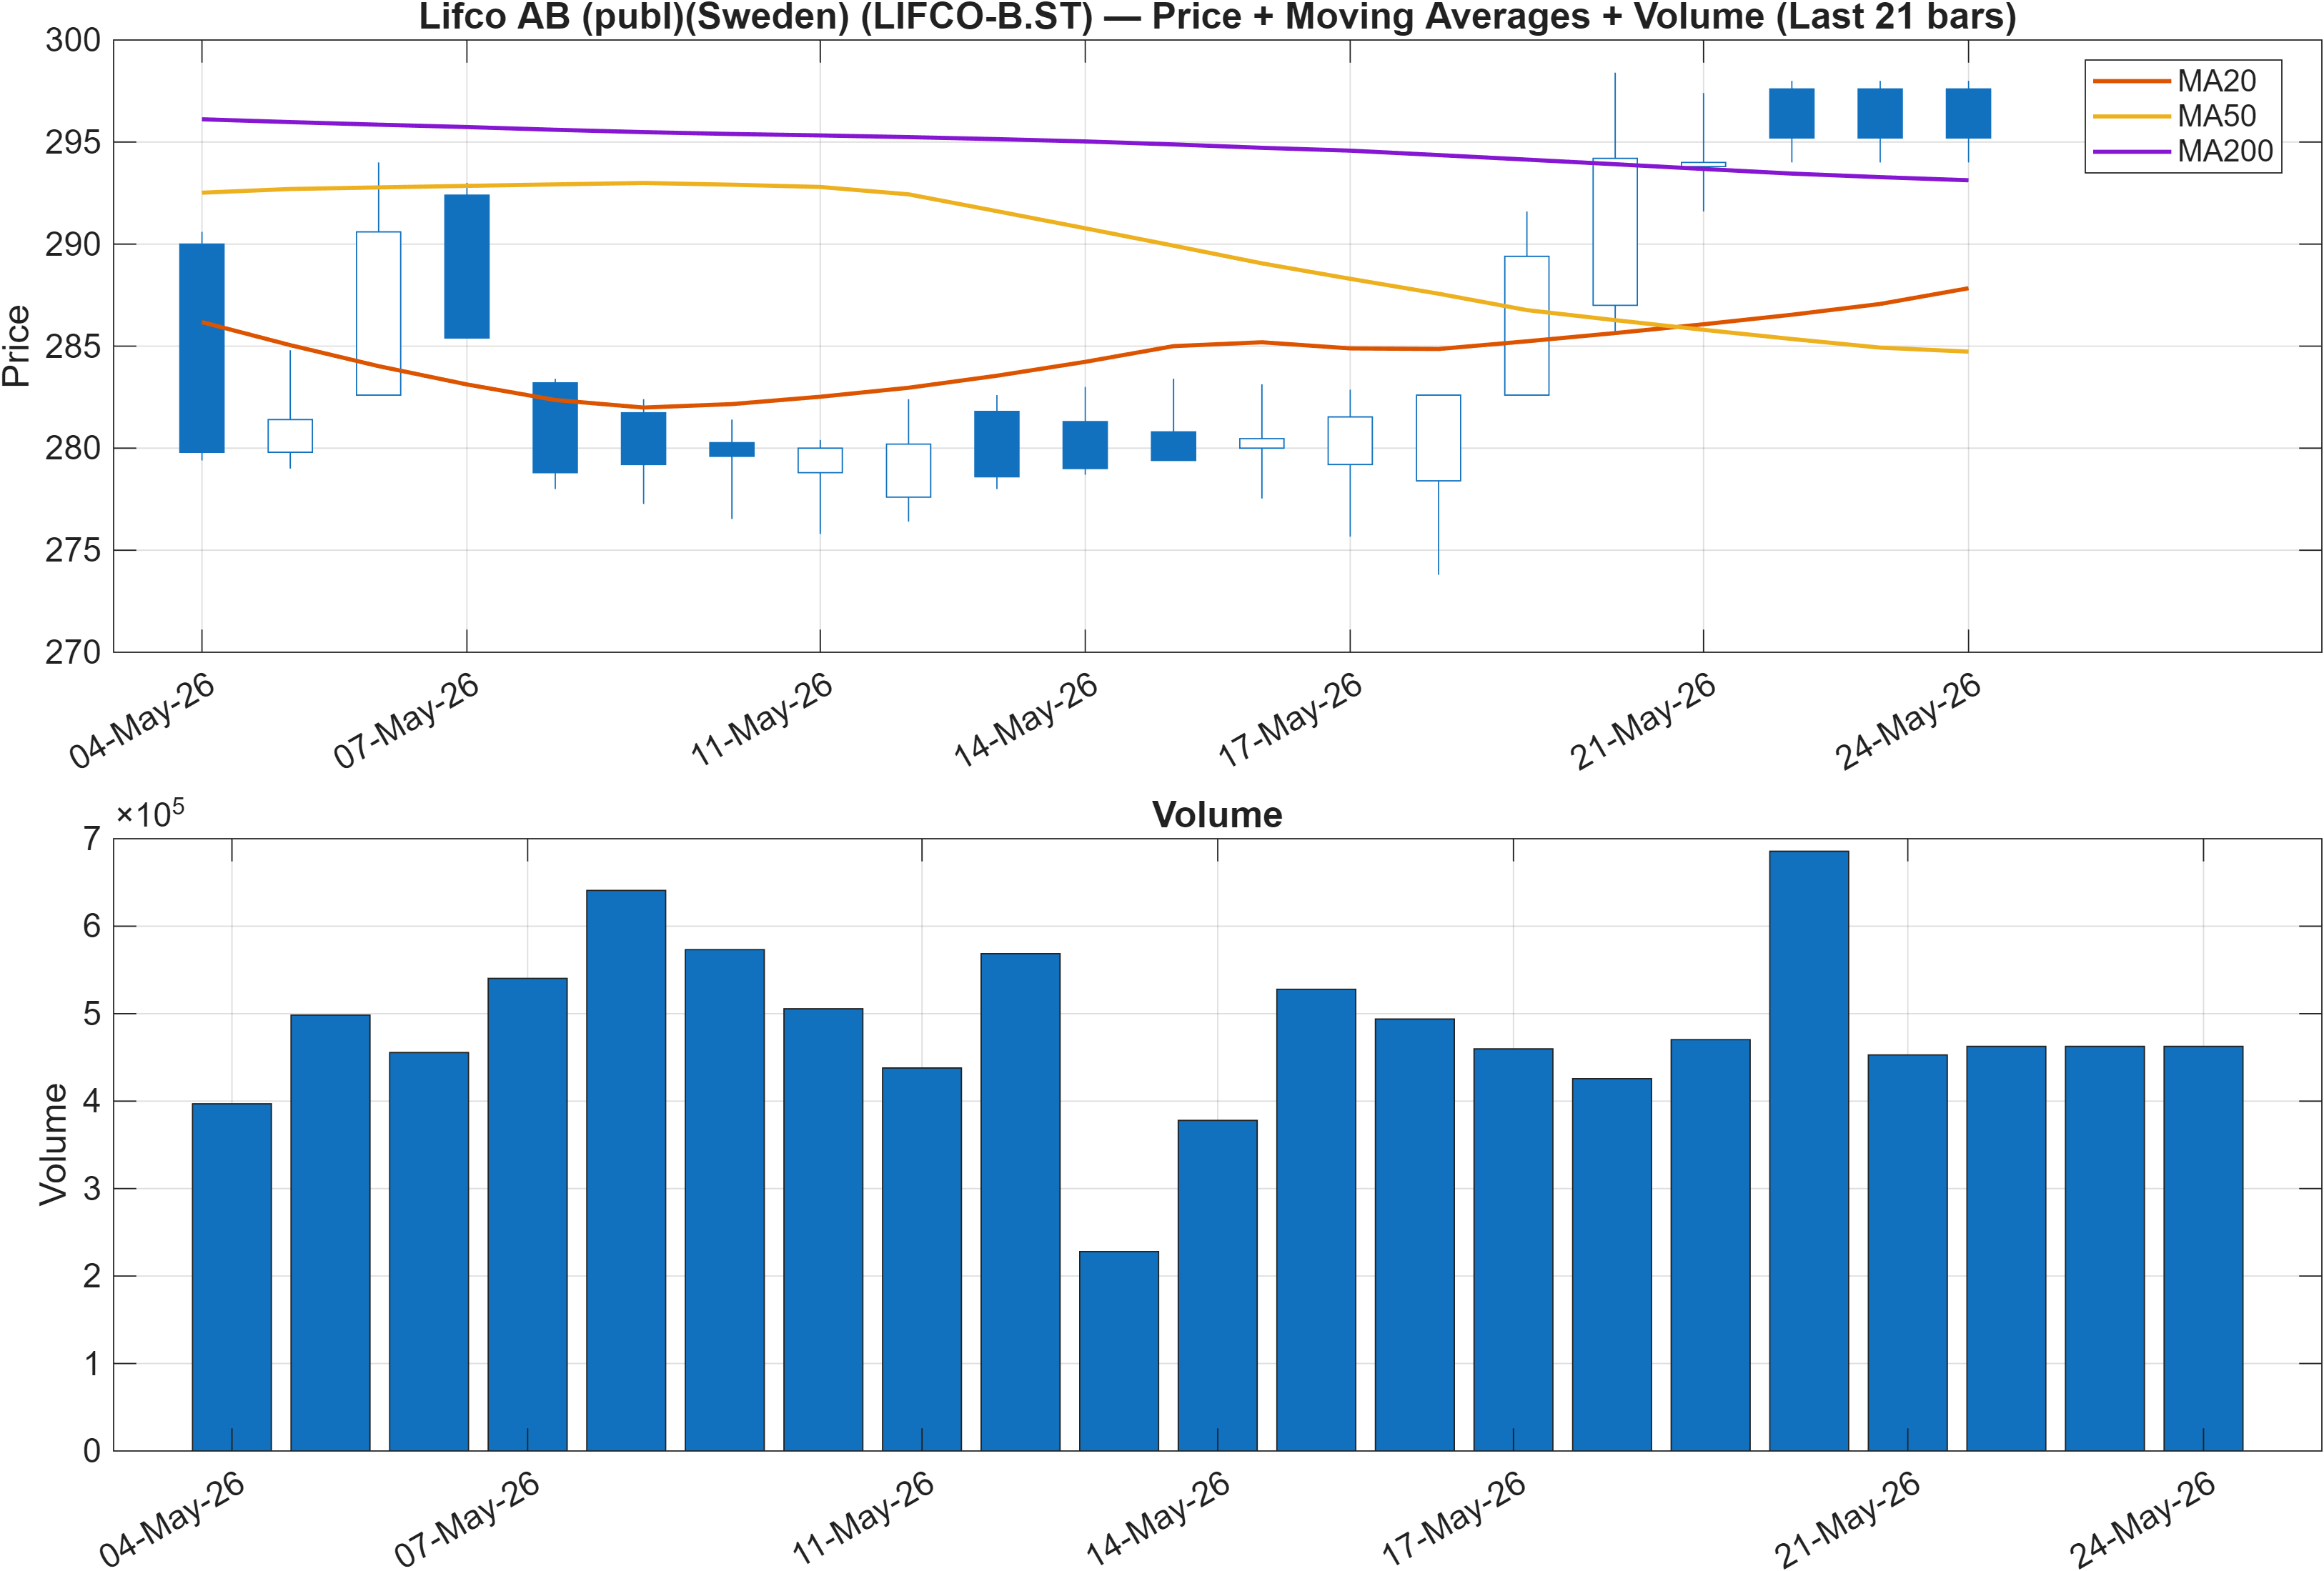
The trend read is explicitly split: close vs MA50 is Bullish, while MA50 vs MA200 is Bearish. This is the classic “short-term extension inside a longer-term transition” structure. It can occur in early-stage recoveries (when price regains a faster average before the long average turns) or in later-stage uptrends that have recently slowed (when the longer relationship remains unfavorable even as the market rebounds).
What makes this configuration analytically relevant alongside the rank data is the potential for regime negotiation. The top-decile multi-month ranks (#4 at 3-month and #6 at 6-month) argue that, despite the slower MA200 relationship, the instrument’s realized behavior has been strong versus peers. That increases the probability that the MA50/MA200 “Bearish” relationship is lagging rather than leading.
The short-horizon ranks (daily #29, weekly #14) align with the bullish close-vs-MA50 condition, suggesting that near-term participation remains supportive. However, until the longer moving-average relationship improves, trend traders typically treat rallies as conditional: continuation is higher-quality when medium/long trend filters stop acting as a constraint.
The practical implication for this report’s framework is to lean on the decision zones discussed later: if the market can hold above the support area around 276.1600 while pressing the upper boundary near 316.5000, the structure remains consistent with an advancing trend. If price loses the support zone, the “short-term bullish vs long-term lagging” mix can unwind quickly as positioning de-risks.
Interpretation: Close vs MA50 = Bullish, MA50 vs MA200 = Bearish.
3) Momentum & volatility dashboard
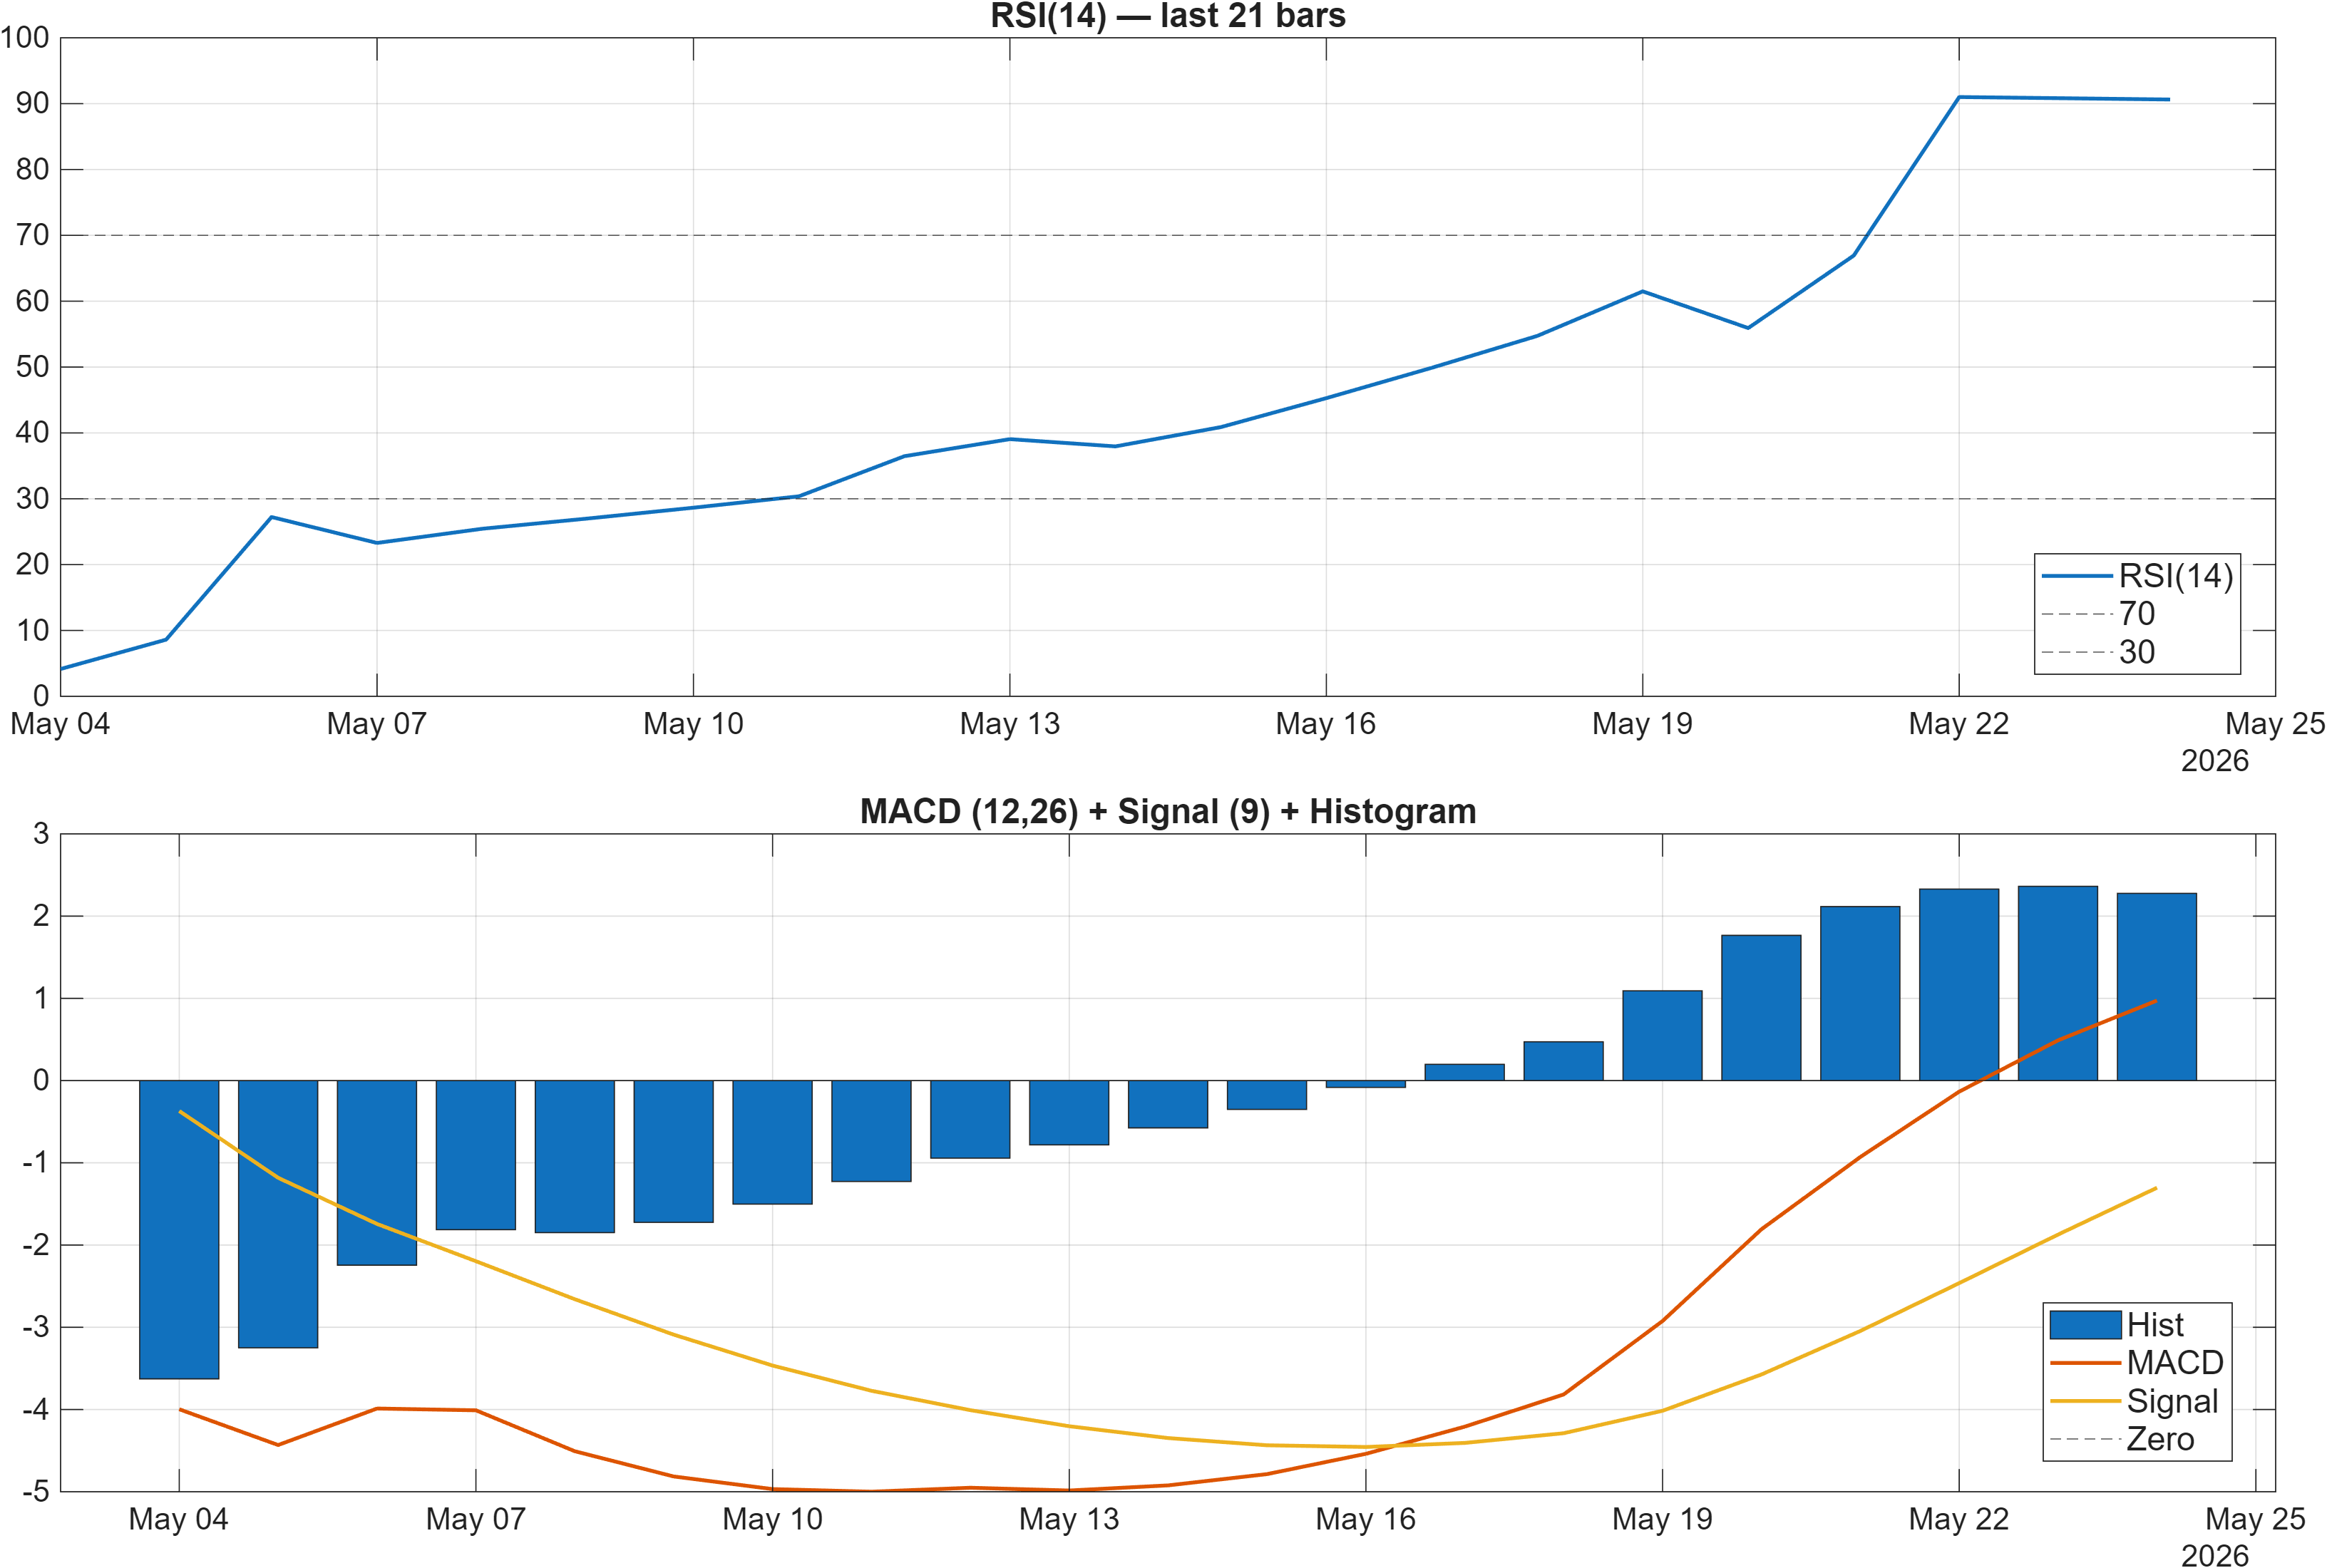
Momentum is the most assertive component of the dashboard. The RSI(14) at 90.63 signals a highly stretched state, while the MACD histogram at 2.2767 remains positive, consistent with ongoing upside impulse rather than a completed move. In isolation, elevated RSI can be interpreted as “overbought,” but in persistent leadership regimes it often functions as a trend-strength marker—until it stops confirming price.
The nuance comes from signal interaction: the signal table later flags Stoch %K at 86.99 as Bearish, which can be read as a short-cycle momentum cooling even as RSI/MACD remain constructive. This is a typical early warning pattern for consolidation risk rather than an outright trend break—especially when longer-horizon ranks stay strong.
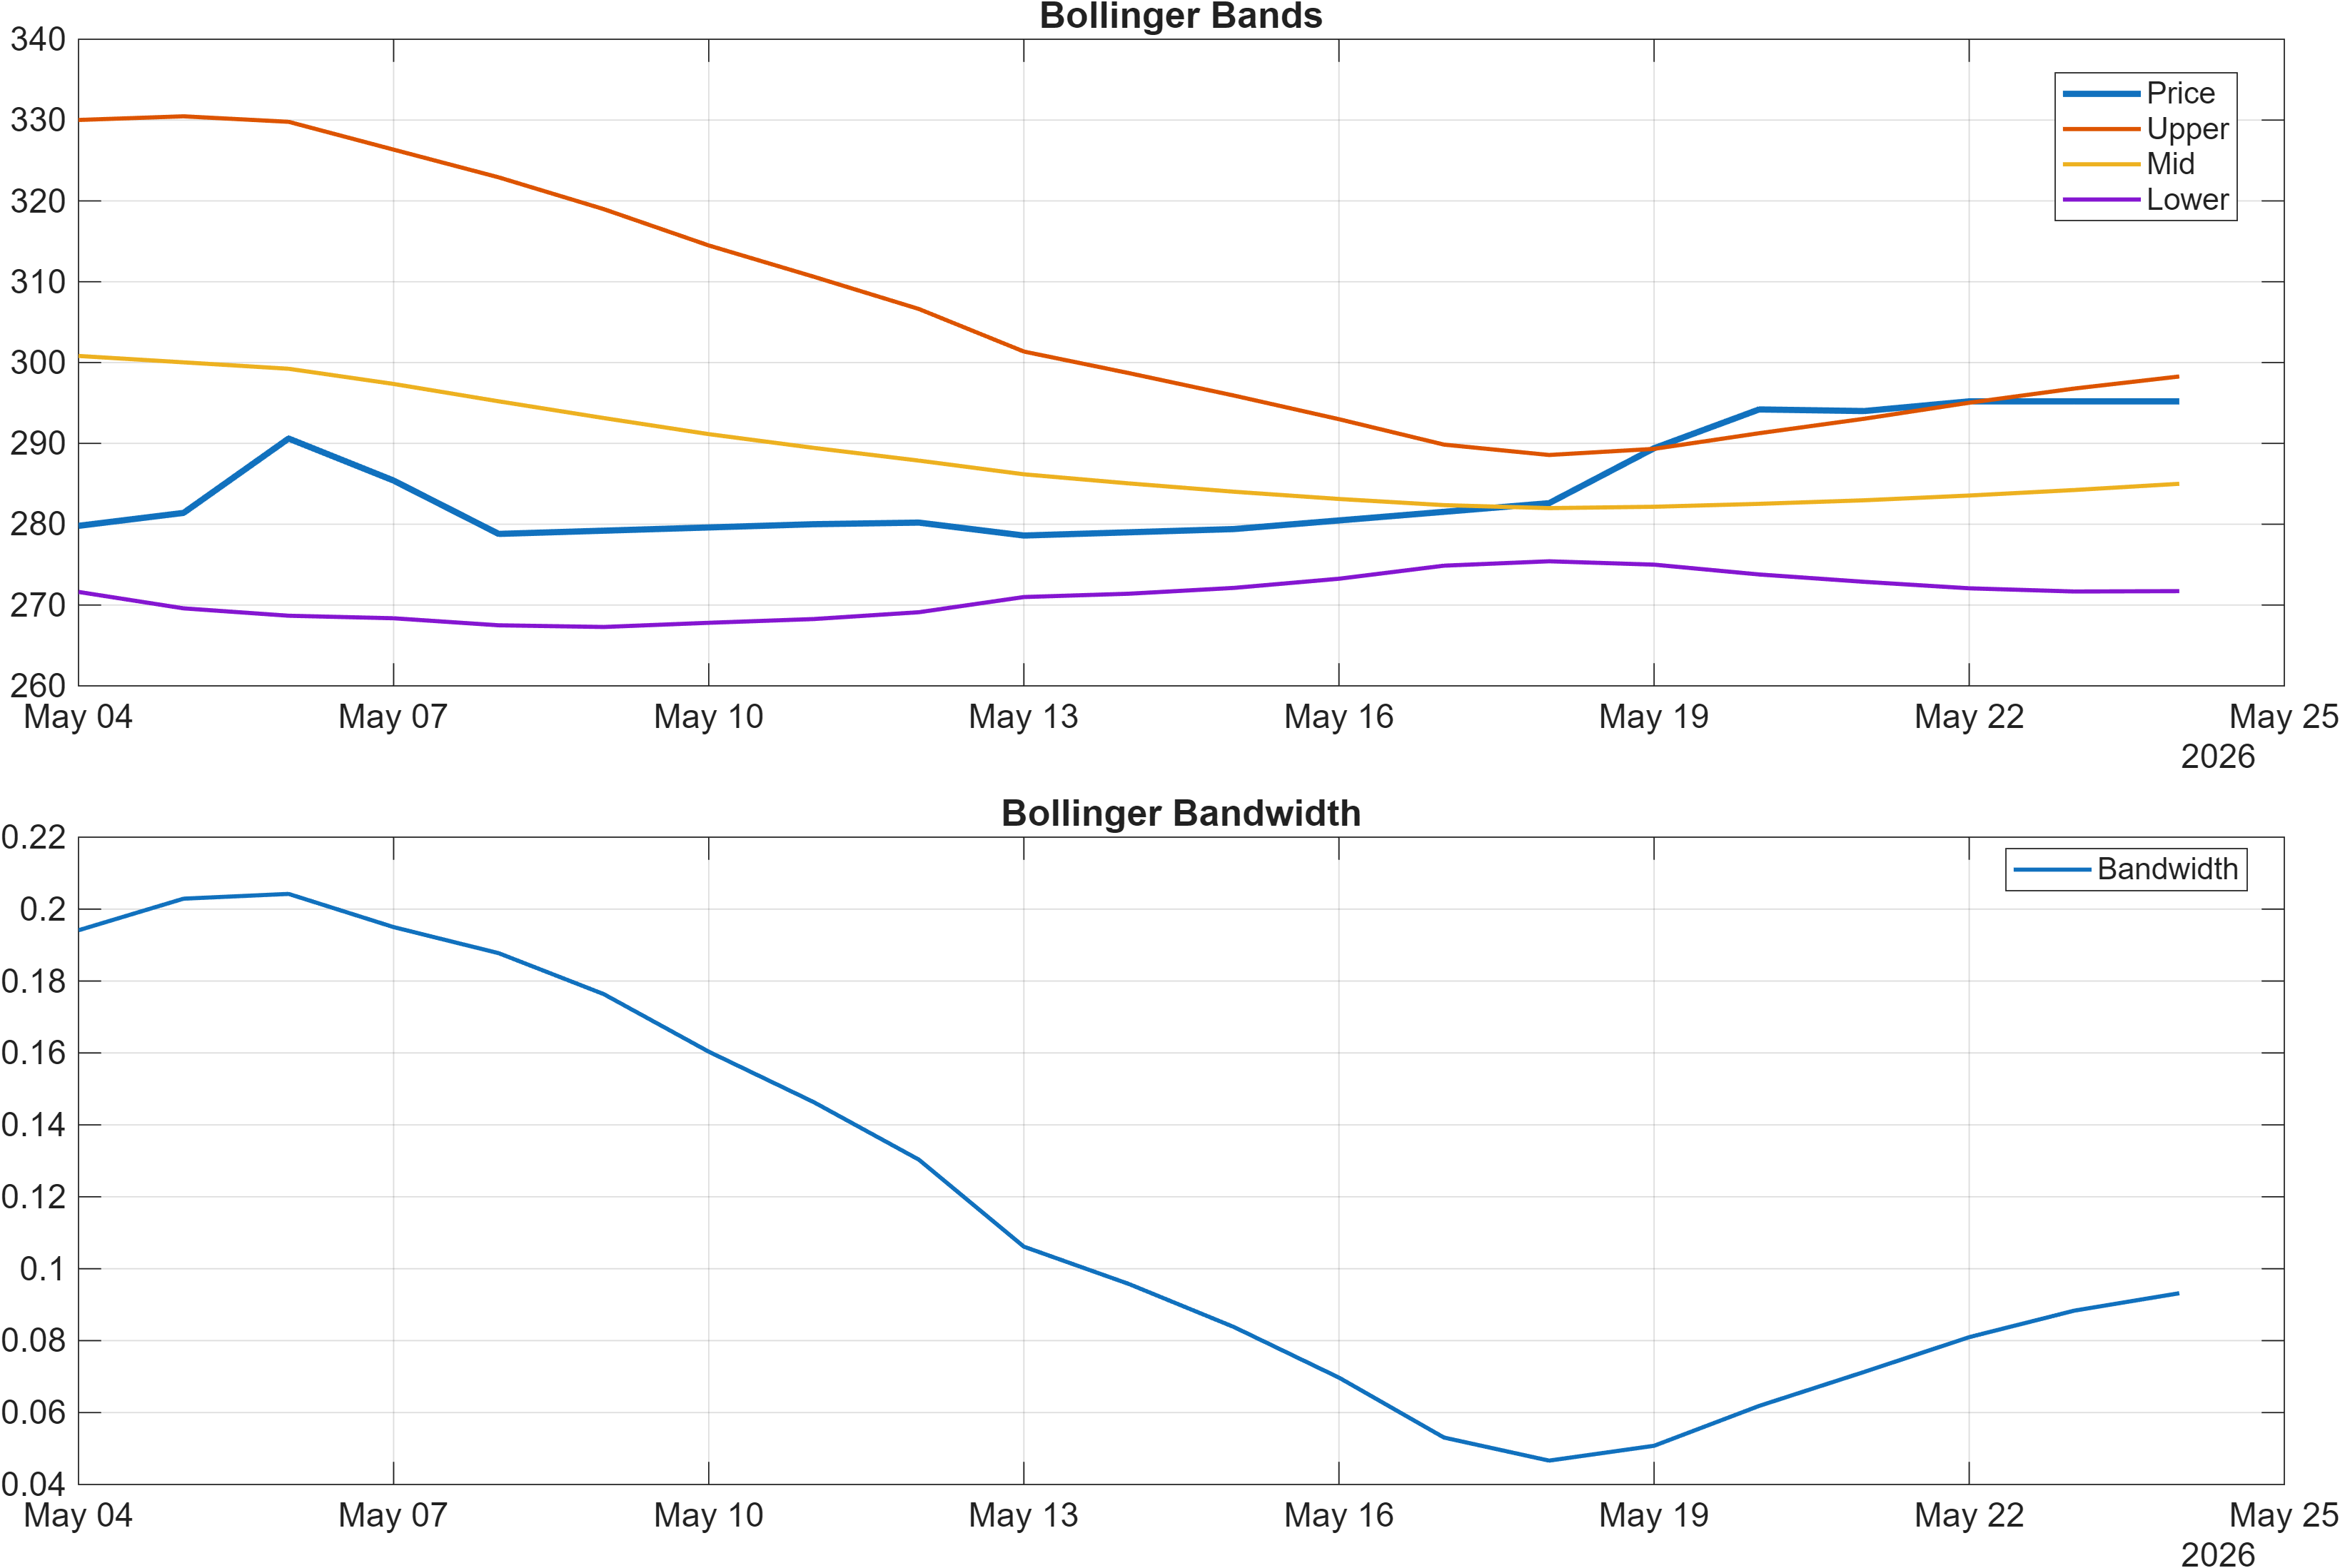
Volatility conditions are comparatively contained. Bollinger bandwidth’s latest reading at 0.0932 suggests the move is not currently accompanied by a volatility expansion regime. When strong momentum meets stable bandwidth, the tape often shifts into either (a) a controlled grind higher or (b) a range that resolves later with a volatility pickup. That makes the nearby support/resistance map more actionable: resolution tends to be cleaner when volatility later expands through a boundary rather than oscillating inside it.
Interpretation: RSI bias = Bullish, MACD hist = 2.2767.
Interpretation: Bandwidth (volatility regime) latest = 0.0932.
4) Support / Resistance zones
Support ~ 276.1600 | Resistance ~ 316.5000
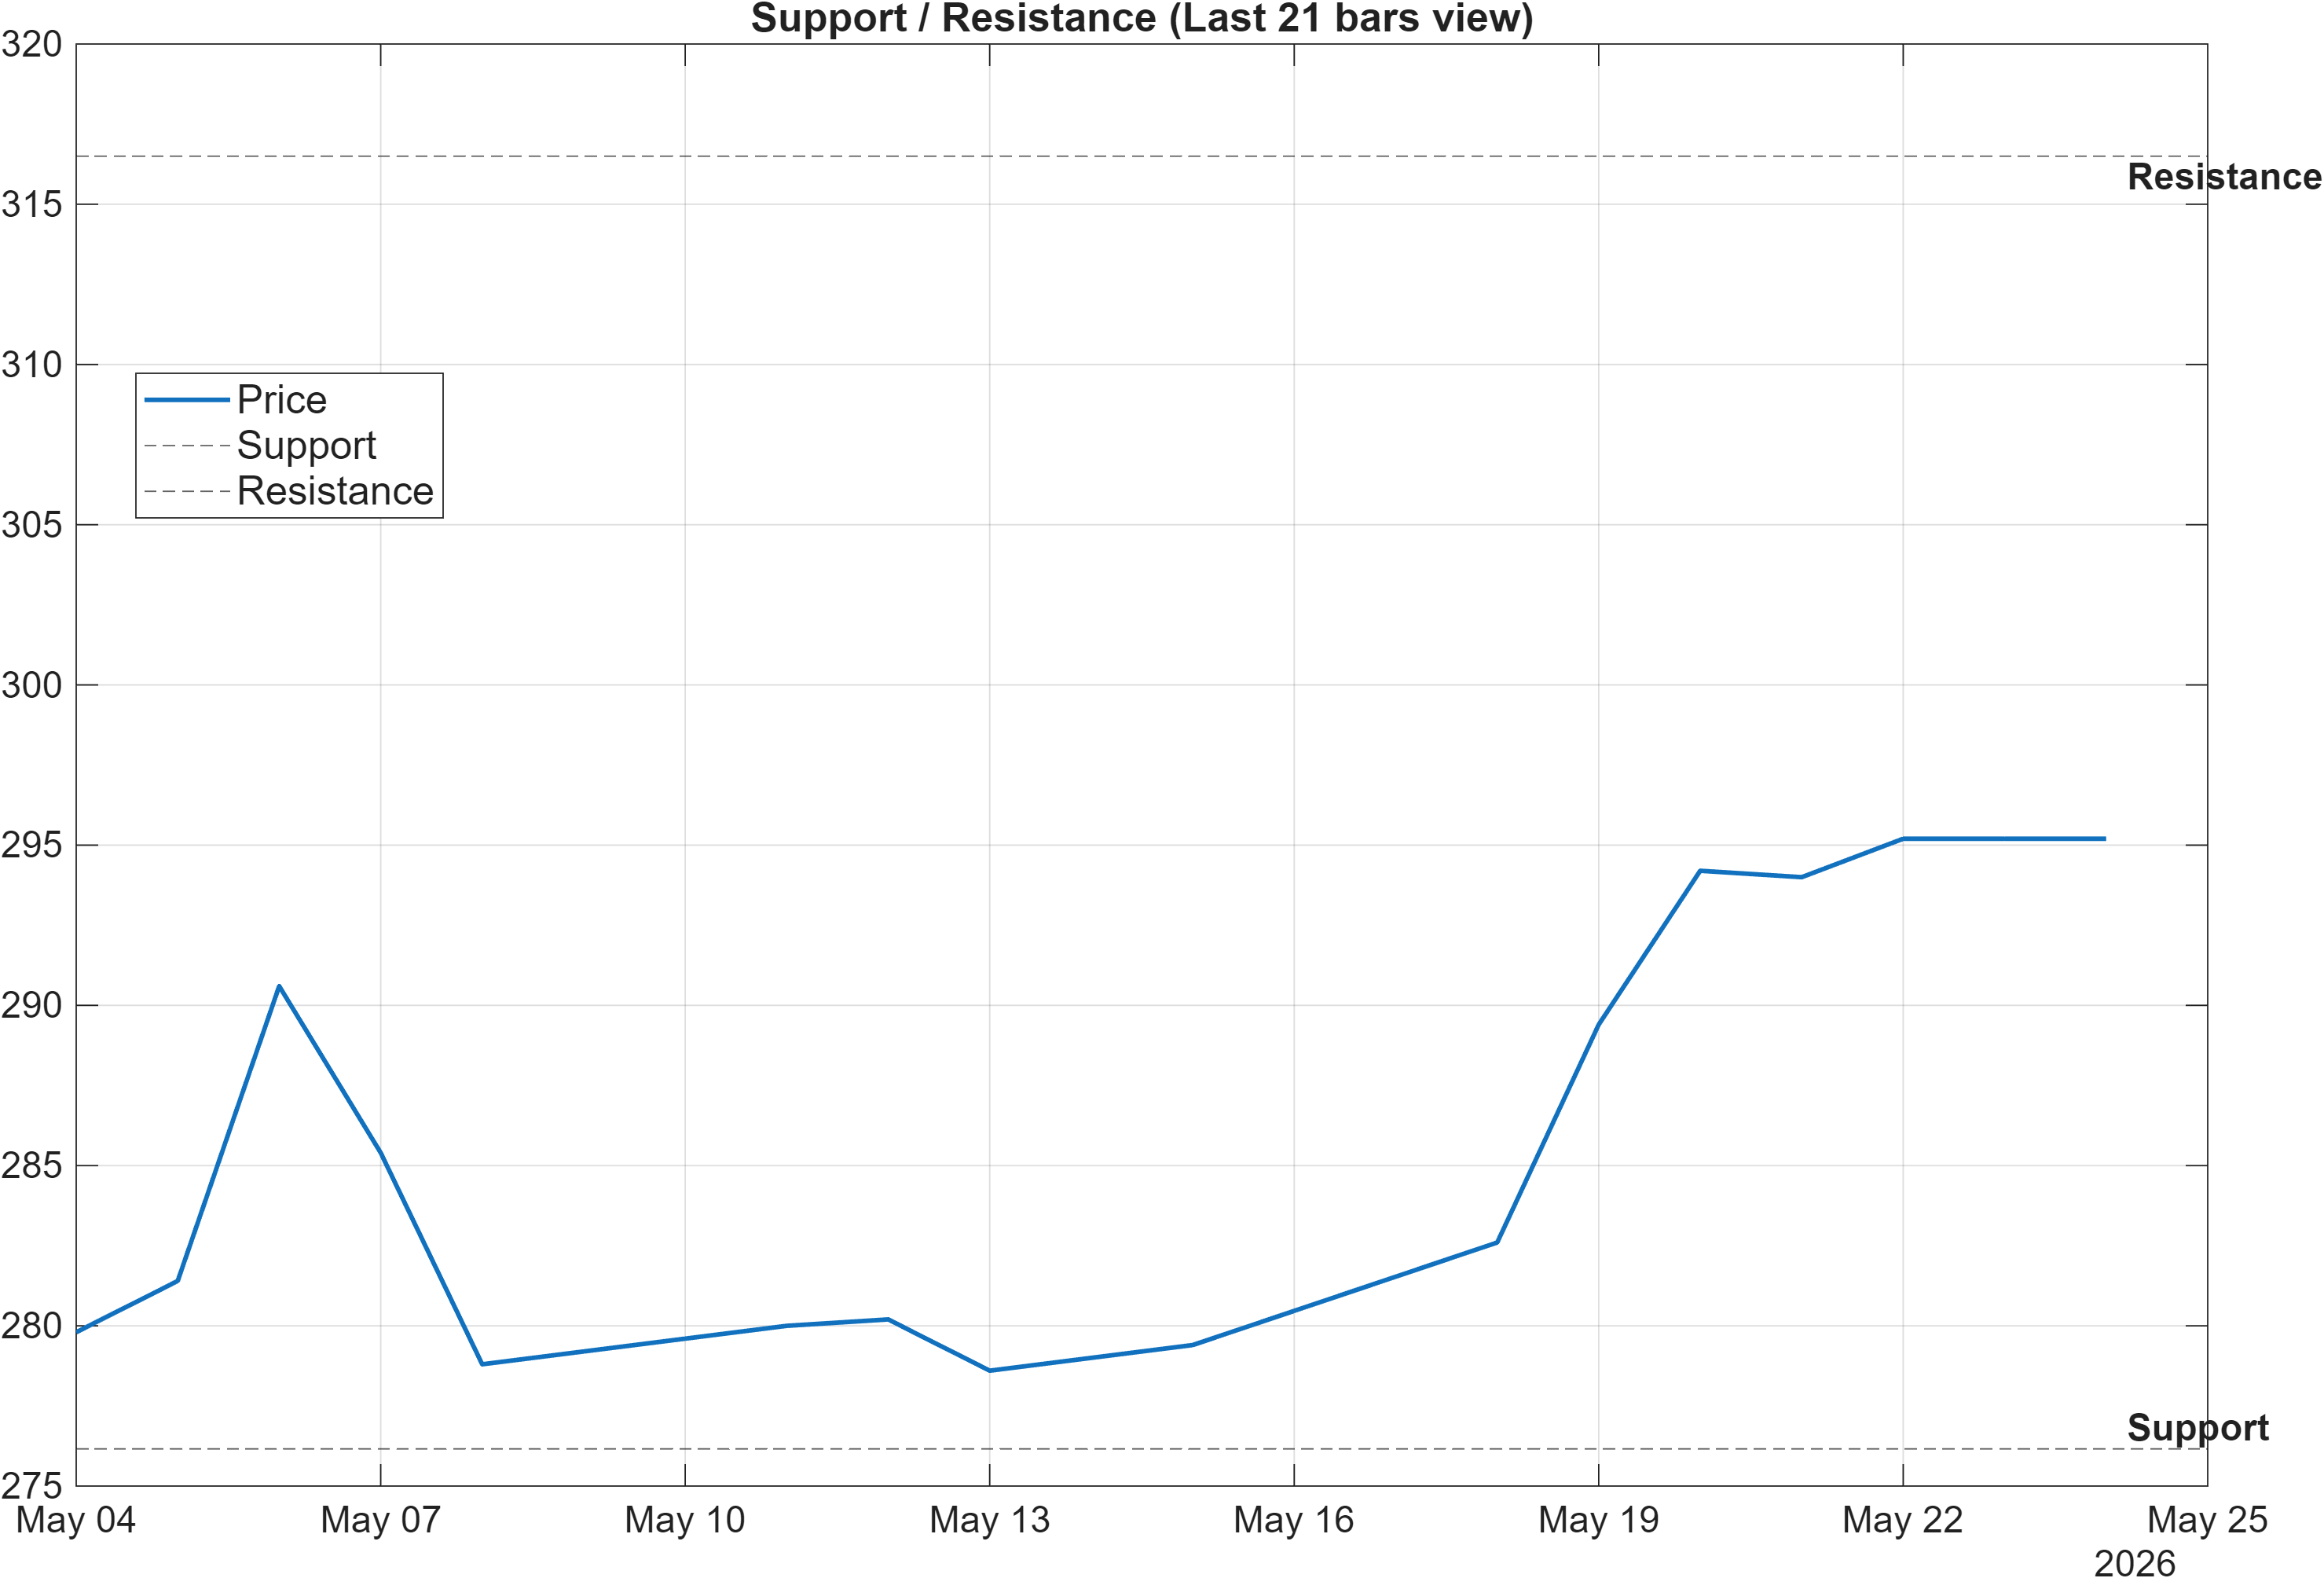
The current map defines a clear decision corridor between 276.1600 (support) and 316.5000 (resistance). With momentum readings elevated (RSI 90.63) and the rank profile strong (3-month #4), the base case within the framework is not to fade strength mechanically, but to demand confirmation at the boundary where supply is expected to appear.
The scenario logic is asymmetric. A break above 316.5000 with volume would align price structure with the “trend persistence” reading coming from ranks and momentum, potentially resolving the mixed moving-average signal (close vs MA50 bullish, MA50 vs MA200 bearish) in favor of continuation. Conversely, a close below 276.1600 would represent a structural failure: it would shift the narrative from “extended but controlled” to “deteriorating,” which is when high RSI conditions can unwind rapidly.
This section also connects directly to the technical dashboard: the signal table includes MedPx vs Support as Bullish with a value of 19.84, implying price is meaningfully above the support reference at the time of calculation. That cushion is constructive, but it also clarifies what would constitute “real” damage: deterioration is less about a minor pullback and more about a decisive loss of the defined floor.
Scenario view: Break above resistance with volume → continuation. Close below support → signal deterioration risk.
5) Quant Technical Dashboard (18 Signals)
KGNAI AI Technical Analysis Score (Deep Reinforcement Learning): Rank #795 out of 1415 (Rank 1 represents the strongest technical positioning and a higher probability of favorable price behavior. As ranks increase toward the maximum, the probability of favorable outcomes weakens and bearish positioning becomes more dominant.) | Label: Neutral | Score: -0.124
18-Signal Technical Confluence Score: 0.389 (Bullish)
Overall Technical Score (18-signal confluence + DRL rank blend): 0.235 (Neutral)
Note: The blended score reflects signal strength weighted against broader AI technical ranking, which may temporarily diverge.
Blended technical score breakdown: 0.235 (Neutral | Bull 11 / Bear 4 / Neutral 3)
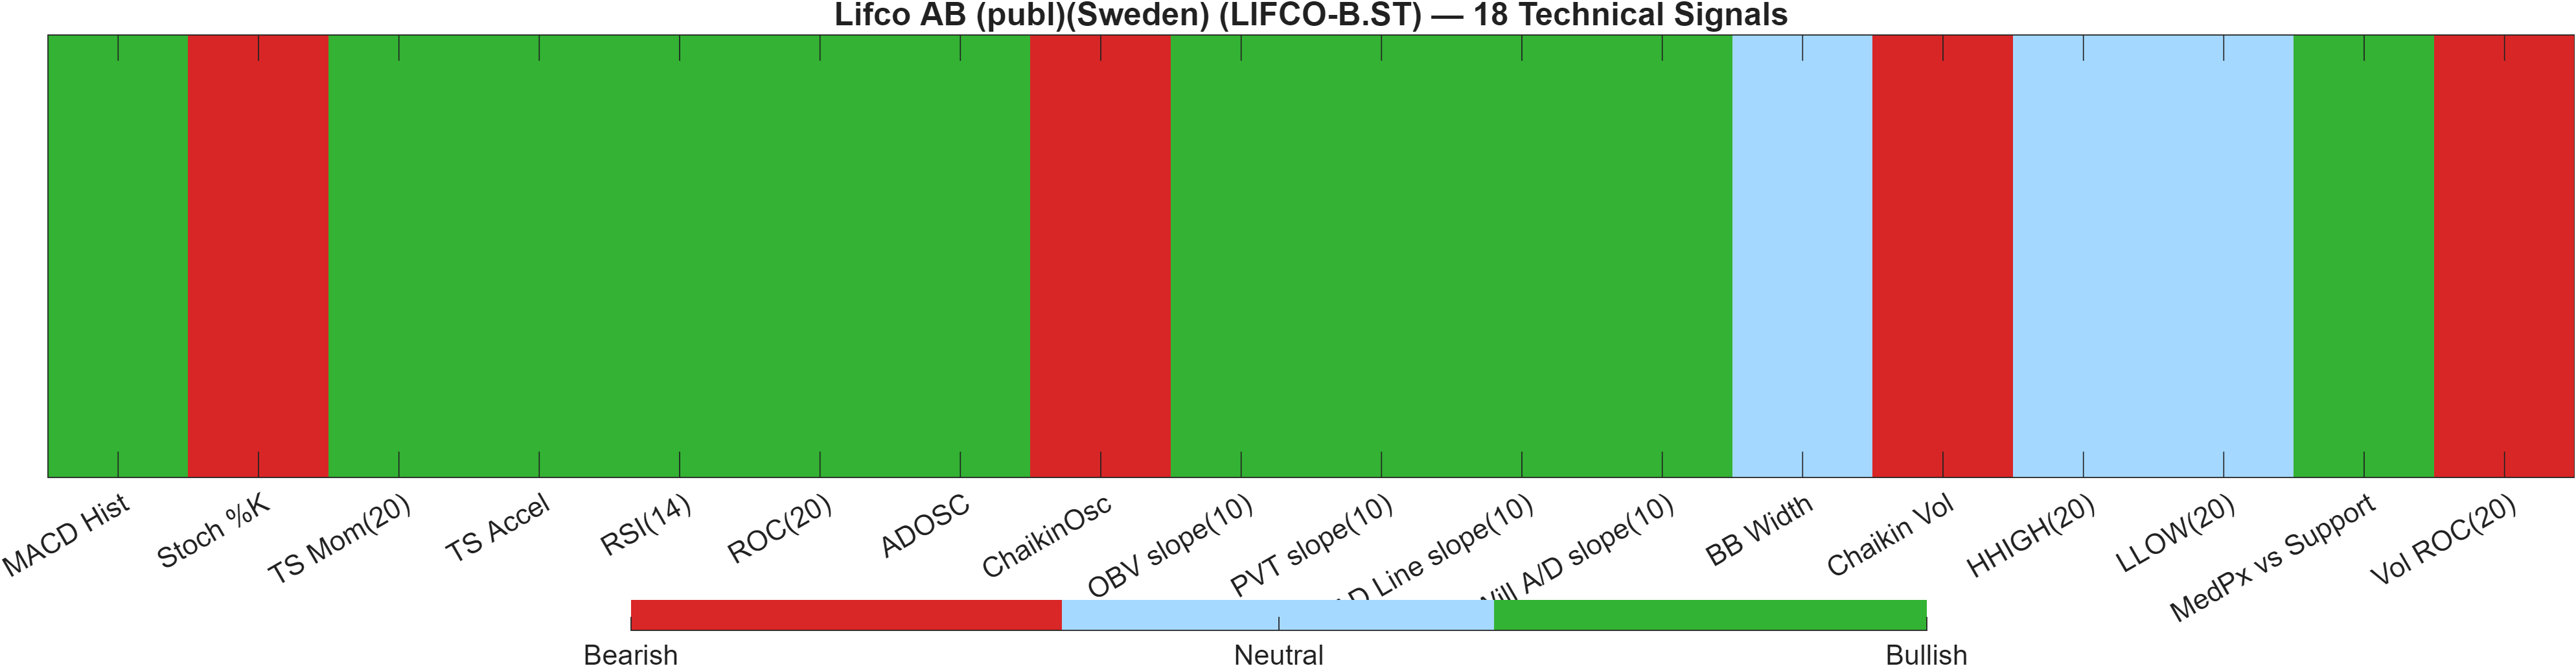
This dashboard is where the report’s main internal tension is most visible. On one hand, the 18-signal confluence score is 0.389 (Bullish), and the breakdown shows 11 Bull signals versus 4 Bear and 3 Neutral. On the other hand, the Deep Reinforcement Learning (DRL) technical rank is #795 out of 1415 with a Neutral label and score -0.124, pulling the blended output to 0.235 (Neutral).
Interpreting that divergence: the indicator stack is currently confirming the move (positive MACD Hist 2.277, strong TS Mom(20) 13.8, and Bullish volume/flow proxies like OBV slope(10) 3.073e+06), while the DRL layer is effectively saying the broader technical state is not as favorable versus the full universe. This can happen when momentum is strong but crowded, when volatility/volume conditions are inconsistent, or when pattern context remains mixed.
The bear signals provide a map of what the model is “uneasy” about. Vol ROC(20) -7.186 points to falling volume rate-of-change even as price strength persists, and Chaikin Vol 7.976 and ChaikinOsc -7.211e+04 add a note of caution around accumulation quality. Combined with a neutral volatility regime (BB Width 0.09318), the technical posture can remain constructive but less explosive—more consistent with digestion than immediate expansion.
Signal table (Bull/Bear/Neutral)
| Indicator | Value | Signal |
|---|---|---|
| MACD Hist | 2.277 | Bullish |
| Stoch %K | 86.99 | Bearish |
| TS Mom(20) | 13.8 | Bullish |
| TS Accel | 41.8 | Bullish |
| RSI(14) | 90.63 | Bullish |
| ROC(20) | 4.904 | Bullish |
| ADOSC | 20 | Bullish |
| ChaikinOsc | -7.211e+04 | Bearish |
| OBV slope(10) | 3.073e+06 | Bullish |
| PVT slope(10) | 3.027e+04 | Bullish |
| AD Line slope(10) | 5.369e+04 | Bullish |
| Will A/D slope(10) | 31.2 | Bullish |
| BB Width | 0.09318 | Neutral |
| Chaikin Vol | 7.976 | Bearish |
| HHIGH(20) | 298.4 | Neutral |
| LLOW(20) | 273.8 | Neutral |
| MedPx vs Support | 19.84 | Bullish |
| Vol ROC(20) | -7.186 | Bearish |
The synthesis is best expressed as: directional impulse is present, but the blended model is requiring additional confirmation (typically through structure/levels or renewed participation) before upgrading the technical state beyond Neutral. In that context, the support/resistance boundaries remain the most disciplined way to arbitrate whether the bullish confluence translates into a durable continuation.
Interpretation: Indicator-level signals form the base confluence, which is then adjusted using a separate AI-driven technical ranking model. The final technical score summarizes this combined view.
6) News sentiment + extractive gist
Note: Instrument-specific news matches were not found, so the digest includes broader market/sector headlines. Links are provided for verification.
Sentiment score (avg): 0.024 | Positive: 19% | Neutral: 69% | Negative: 12%
KGNAI AI News Sentiment Score (normalized -1 to +1): 0.99 (as of 2026-04-25) | Label: Bullish | Overall news score: 1.00
Positive Developments
Recent coverage across major financial outlets indicates a modestly constructive backdrop driven more by macro and cross-asset narratives than by company-specific catalysts (not available in the provided data). The normalized news signal is strongly positive at 0.99, which suggests the model is detecting favorable language clustering in the broader information set. That said, the distribution remains dominated by neutral items (69% neutral versus 19% positive), consistent with a market that is absorbing developments rather than repricing aggressively. In practice, this combination often supports trend persistence when technical structure is already constructive: it reduces the probability of abrupt sentiment shocks while leaving room for incremental positive interpretation. For LIFCO-B.ST specifically, the implication is contextual rather than causal—the supportive read is best treated as a tailwind to the existing bullish rank posture (e.g., 3-month #4), not as a standalone trigger.
Neutral / Mixed Developments
The average sentiment score of 0.024 sits near flat, reinforcing that the news backdrop is not uniformly directional. Mixed messaging typically expresses itself through “risk-on / risk-off” rotation across rates, commodities, and geopolitics; those dynamics can raise short-term noise even when medium-term trends remain intact. With momentum already extended (RSI 90.63) and volatility contained (bandwidth 0.0932), neutral news flow can act as a stabilizer—encouraging consolidation rather than forcing a decisive breakout or breakdown. In that regime, price levels matter more than narratives: the market tends to respect well-defined boundaries until a new catalyst (macro or sector) pushes volatility higher.
Negative / Risk Signals
Risk-oriented coverage across major financial outlets highlights the typical late-cycle stress points: rate volatility, bond-market instability, and geopolitical uncertainty. Even when not linked to the instrument directly, such themes can impact liquidity and risk appetite, which is relevant when the technical blend is already Neutral (0.235) despite bullish confluence. Negative flow is not dominant (12% negative), but it can still matter because extended momentum conditions can become more sensitive to adverse surprises. Within this report’s framework, the key is to treat risk signals as a catalyst for validation: if the market can hold above 276.1600 during broader risk-off episodes, it strengthens the interpretation that the bullish ranks reflect durable sponsorship rather than transient momentum.
- What to monitor next: Whether price acceptance improves above 316.5000 alongside renewed participation (volume confirmation).
- What to monitor next: Any further deterioration in participation proxies (e.g., Vol ROC(20) -7.186) if price stalls near resistance.
- What to monitor next: Whether volatility shifts from containment (bandwidth 0.0932) toward expansion, which often accompanies regime resolution.
Snapshot: AI Rank (Short–Mid–Long): Bullish (Bullish–Bullish–Bullish) · Technical Confluence: Bullish · Key Levels: Support ~276.16 | Resistance ~316.50 · News Sentiment: Neutral
Sources referenced: Reuters, Bloomberg, Yahoo Finance, MarketWatch, Investing.com
7) Sources
- Trump says deal with Iran to reopen Hormuz ‘largely negotiated’ — https://www.ft.com/content/a27cc653-71ee-4668-8fcf-562fd7c9b93f
- US and Iran move closer to extending ceasefire by 60 days, say mediators — https://www.ft.com/content/0f6f9962-c6c4-4c75-bba2-8b103edfbc85
- US oil producers increase output to capture price surge from Iran war — https://www.ft.com/content/d0fc0074-86f1-46ec-bf80-9bbb6abb2c24
- The new arms race in computing power — https://www.ft.com/content/5aecd7b6-652f-4edb-b666-71f3f50fc43e
- Bond slump stirs vigilante fears — https://www.ft.com/content/e16e6cdf-e824-4bc1-a199-e42746e602bb
- Arsenal’s hold on the streets and the elites — https://www.ft.com/content/2491cee3-8644-4cad-829d-8749f639515b
- Russia pounds Kyiv with missiles and drones in heavy overnight assault — https://www.ft.com/content/334b2b9e-10c5-4292-aa53-c1c0589f1413
- Man shot dead by Secret Service after exchanging gunfire outside White House — https://www.ft.com/content/a4b3f6e0-c0e7-4a80-b5ea-7d8dd4dd4de8
You may also like: How KGNAI AI ranks instruments across global markets
Disclaimer: KGNAI provides AI-generated analytics and educational market commentary only. This is not financial advice. Markets involve risk. Always do your own research.