
MBWS.PA — Marie Brizard Wine & Spirits(France) | 20-May-2026 Technical Ranges Intact with Bearish Rank Pressure
Marie Brizard Wine & Spirits(France) (MBWS.PA) enters 20-May-2026 with a weak relative rank profile across the tracked EUROPE universe (1417 instruments), while the technical confluence remains Neutral—a combination that often describes a market that is heavy but still range-bound. The key structure is defined by support near 2.7000 and resistance near 2.8050, with current indicator readings leaning bearish on momentum (notably RSI and MACD histogram) even as certain volume/accumulation signals show intermittent improvement. Volatility is present but not extreme, with Bollinger bandwidth at 0.0440, suggesting the price can oscillate within the defined band rather than trend smoothly. News sentiment data is constructive on a normalized basis, but price/technical behavior implies the market is still demanding confirmation through a clean break of resistance or a defended retest of support.
- Rank stance: Short Bearish | Mid Bearish | Long Bearish
- Technical confluence: Neutral (18-signal confluence -0.278; blended overall -0.254)
- Key levels: Support ~ 2.7000 | Resistance ~ 2.8050
- News sentiment bias: Neutral overall mix (avg 0.126; normalized score 0.87 labeled Bullish)
- Confirmation / invalidation condition: A sustained break above 2.8050 with volume improves continuation odds; a close below 2.7000 elevates deterioration risk.
KGNAI evaluates assets using large cross-sectional datasets built from millions of structured data points. Inputs incorporate fundamental metrics, technical structures, and systematically processed news sentiment. Statistical models, machine learning, and AI frameworks are used to assess relative positioning, signal alignment, and probabilistic behavior across broad universes.
- Ranks are comparative across the tracked universe, not absolute price targets.
- Confluence reflects alignment among independent signal groups.
- Support/resistance levels are probabilistic decision zones, not guarantees.
- Sentiment provides contextual bias within the broader analytical framework.
1) KGNAI AI Analysis
Region: EUROPE
Total universe size: 1417 ranked instruments
- Daily rank: #1236 out of 1417 — Bearish
- Weekly rank: #1099 out of 1417 — Neutral
- Monthly rank: #1163 out of 1417 — Bearish
- 3-Monthly rank: #1089 out of 1417 — Neutral
- 6-Monthly rank: #1095 out of 1417 — Neutral
- Yearly rank: #1290 out of 1417 — Bearish
MBWS.PA screens as a lower-third to bottom-decile instrument in several horizons, with the Daily rank (#1236) and Yearly rank (#1290) both indicating weak relative positioning within the 1417-name universe. That matters for context: even when near-term charts appear capable of short bounces, a consistently high (weaker) rank often coincides with fragile follow-through and higher probability of failed rallies.
The term view is explicitly Bearish across short-, mid-, and long-term horizons, but the distribution of labels across intermediate ranks is not uniformly negative (Weekly and 3- to 6-month ranks are Neutral). This mixture can occur when price is compressing rather than trending cleanly—i.e., the market is not consistently rewarding directional exposure despite the broader bearish bias.
Interpretation should stay probabilistic: ranks describe relative behavior tendencies rather than deterministic outcomes. For MBWS.PA, the most decision-relevant takeaway is that the cross-horizon weakness increases the burden of proof for bulls—typically requiring clean technical confirmation at resistance (2.8050) and/or improved momentum metrics (e.g., RSI recovery) before the rank headwind is meaningfully challenged.
Term view: Short-term: Bearish. Mid-term: Bearish. Long-term: Bearish.
2) Price & trend overview
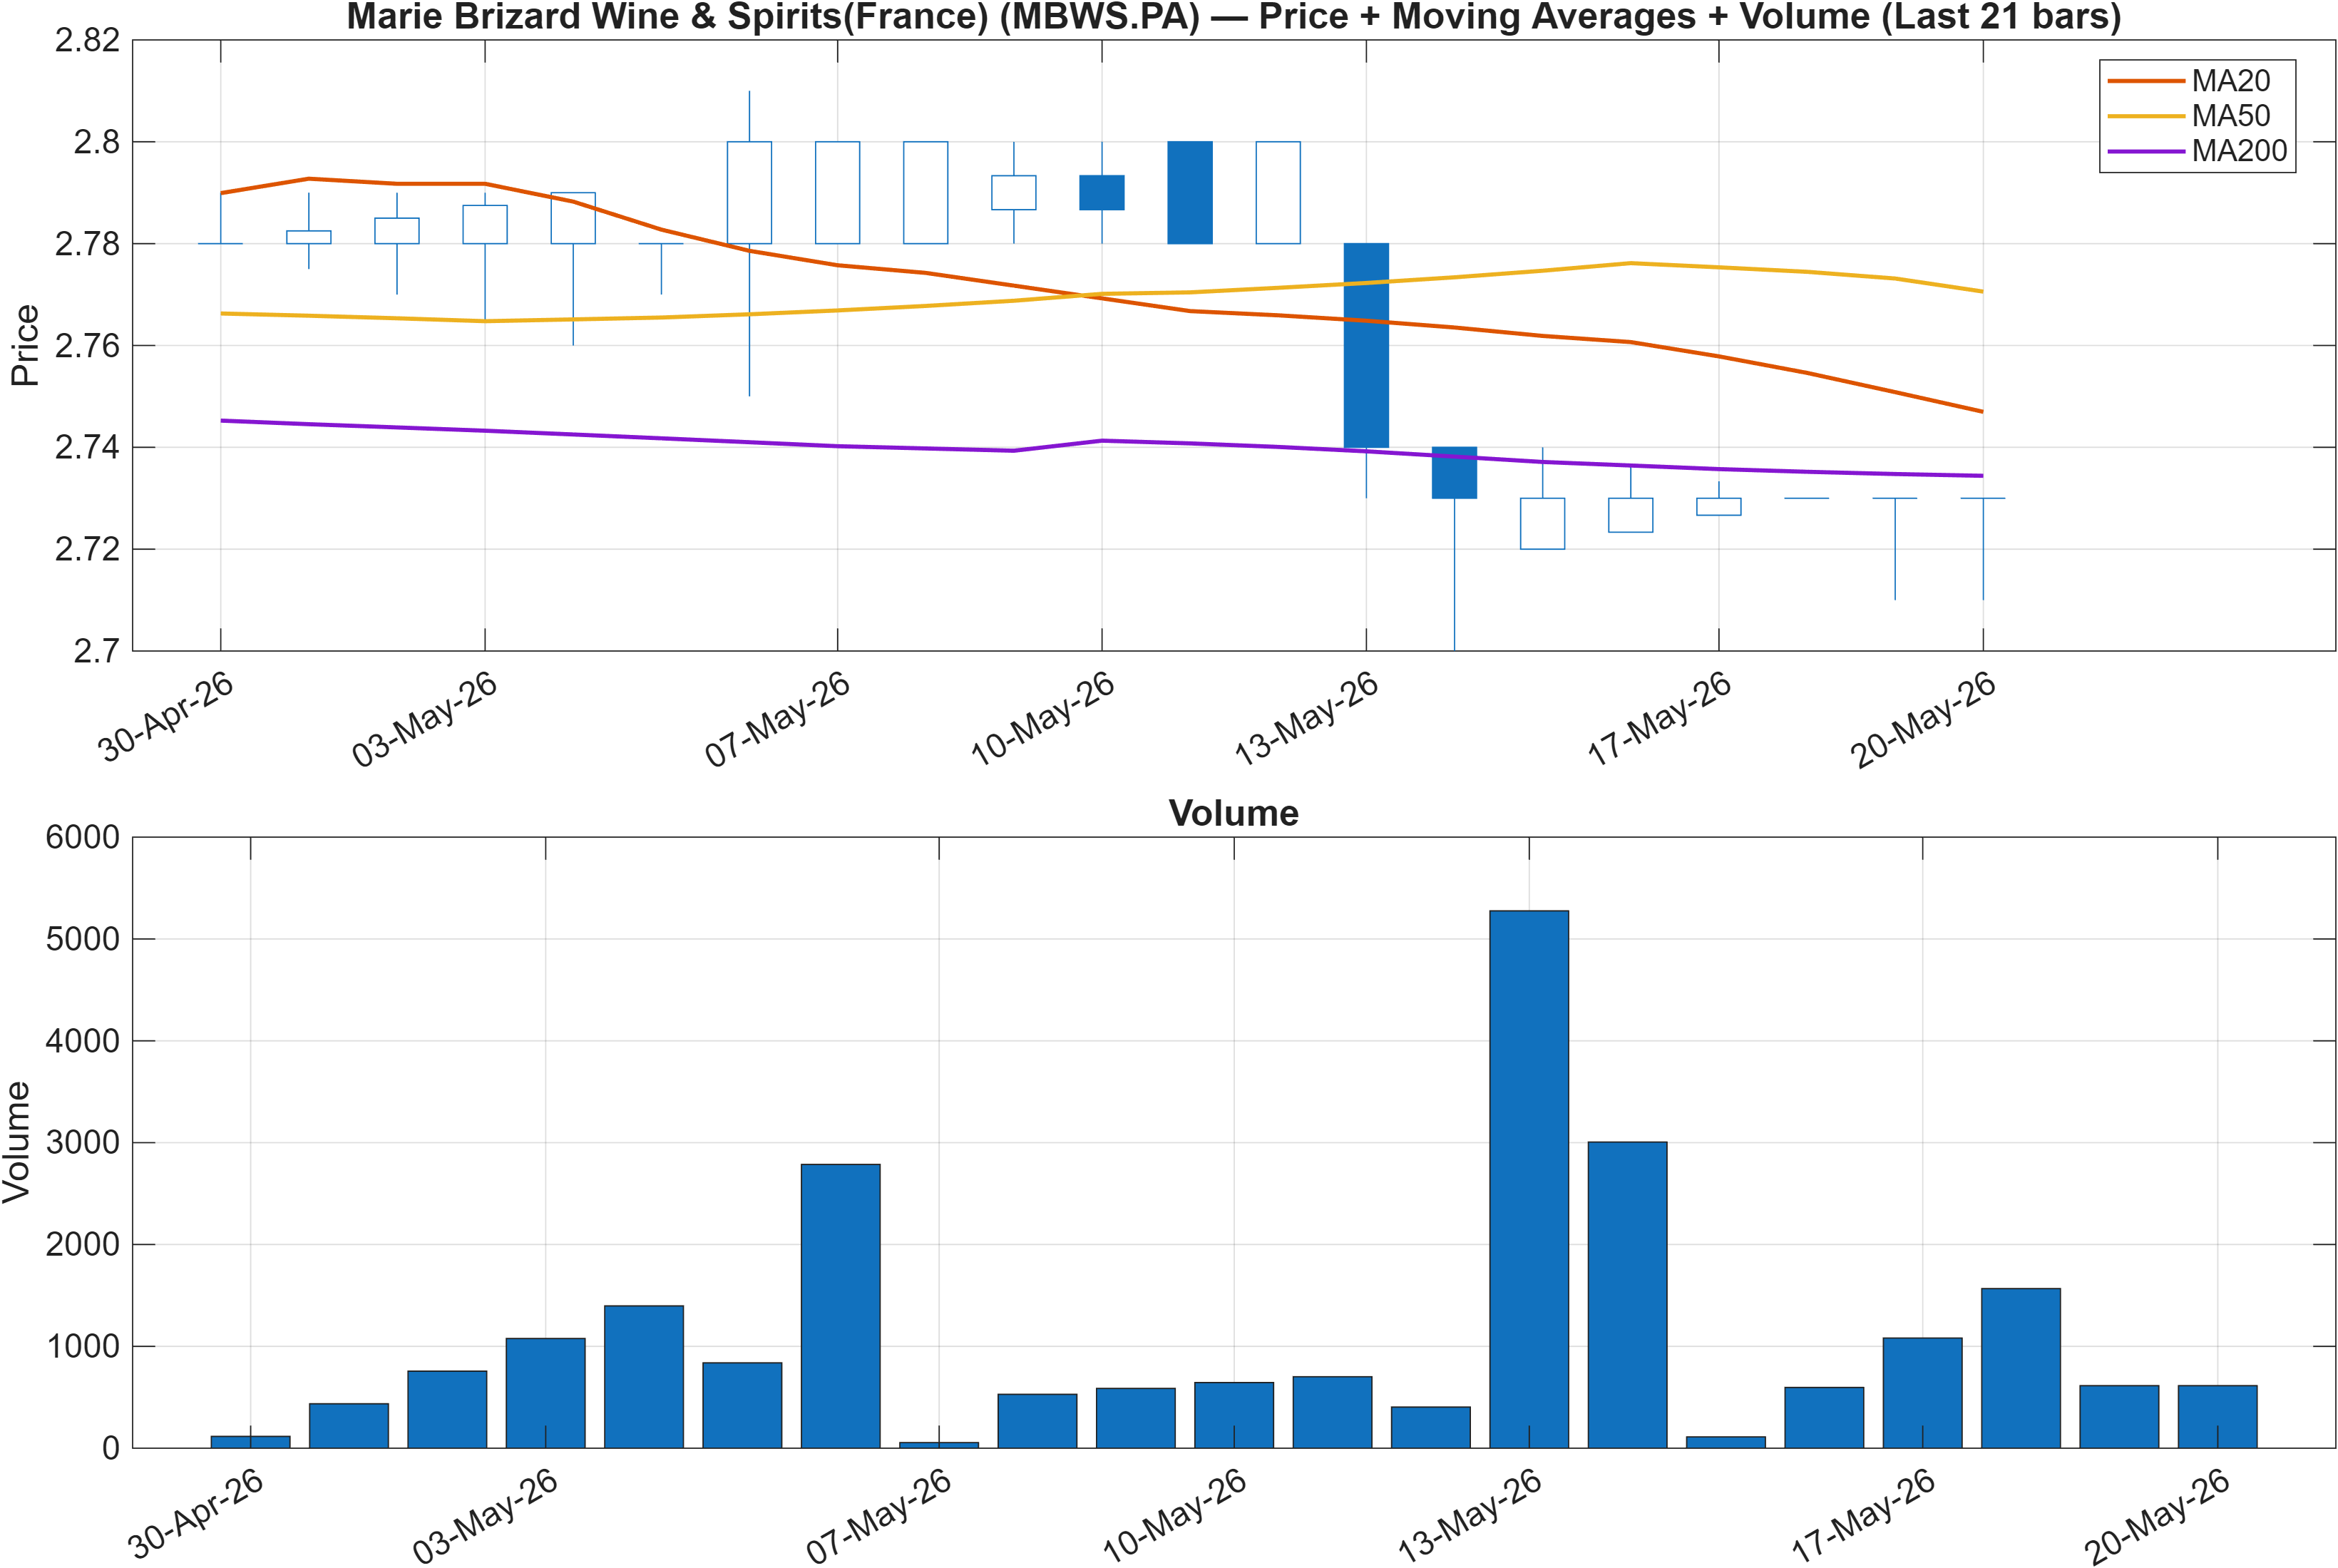
The moving-average read is internally split: Close vs MA50 = Bearish, while MA50 vs MA200 = Bullish. This combination frequently signals a market in a pullback phase within a longer baseline recovery, or a lagging longer-term trend that has not yet been invalidated despite near-term weakness. In practice, that often produces range trading where short rallies fade into overhead supply until momentum improves.
Alignment vs divergence: short-term weakness inside a longer baseline
With resistance defined near 2.8050 and support near 2.7000, trend interpretation becomes less about “up vs down” and more about whether the tape is respecting boundaries. A bearish close-versus-MA50 condition tends to coincide with sellers defending rebounds, which is consistent with the report’s stance that resistance levels are holding and capping upside attempts.
Trend persistence vs exhaustion: what would change the posture
For this profile, a convincing shift would typically require a two-part progression: first, price action that holds above the shorter trend reference (implied by the MA50 relationship), and second, enough follow-through to test and clear 2.8050. Until then, the MA structure argues for caution on upside impulses, while the longer MA alignment (MA50 above MA200) leaves room for a stabilization narrative if support at 2.7000 remains intact.
3) Momentum & volatility dashboard
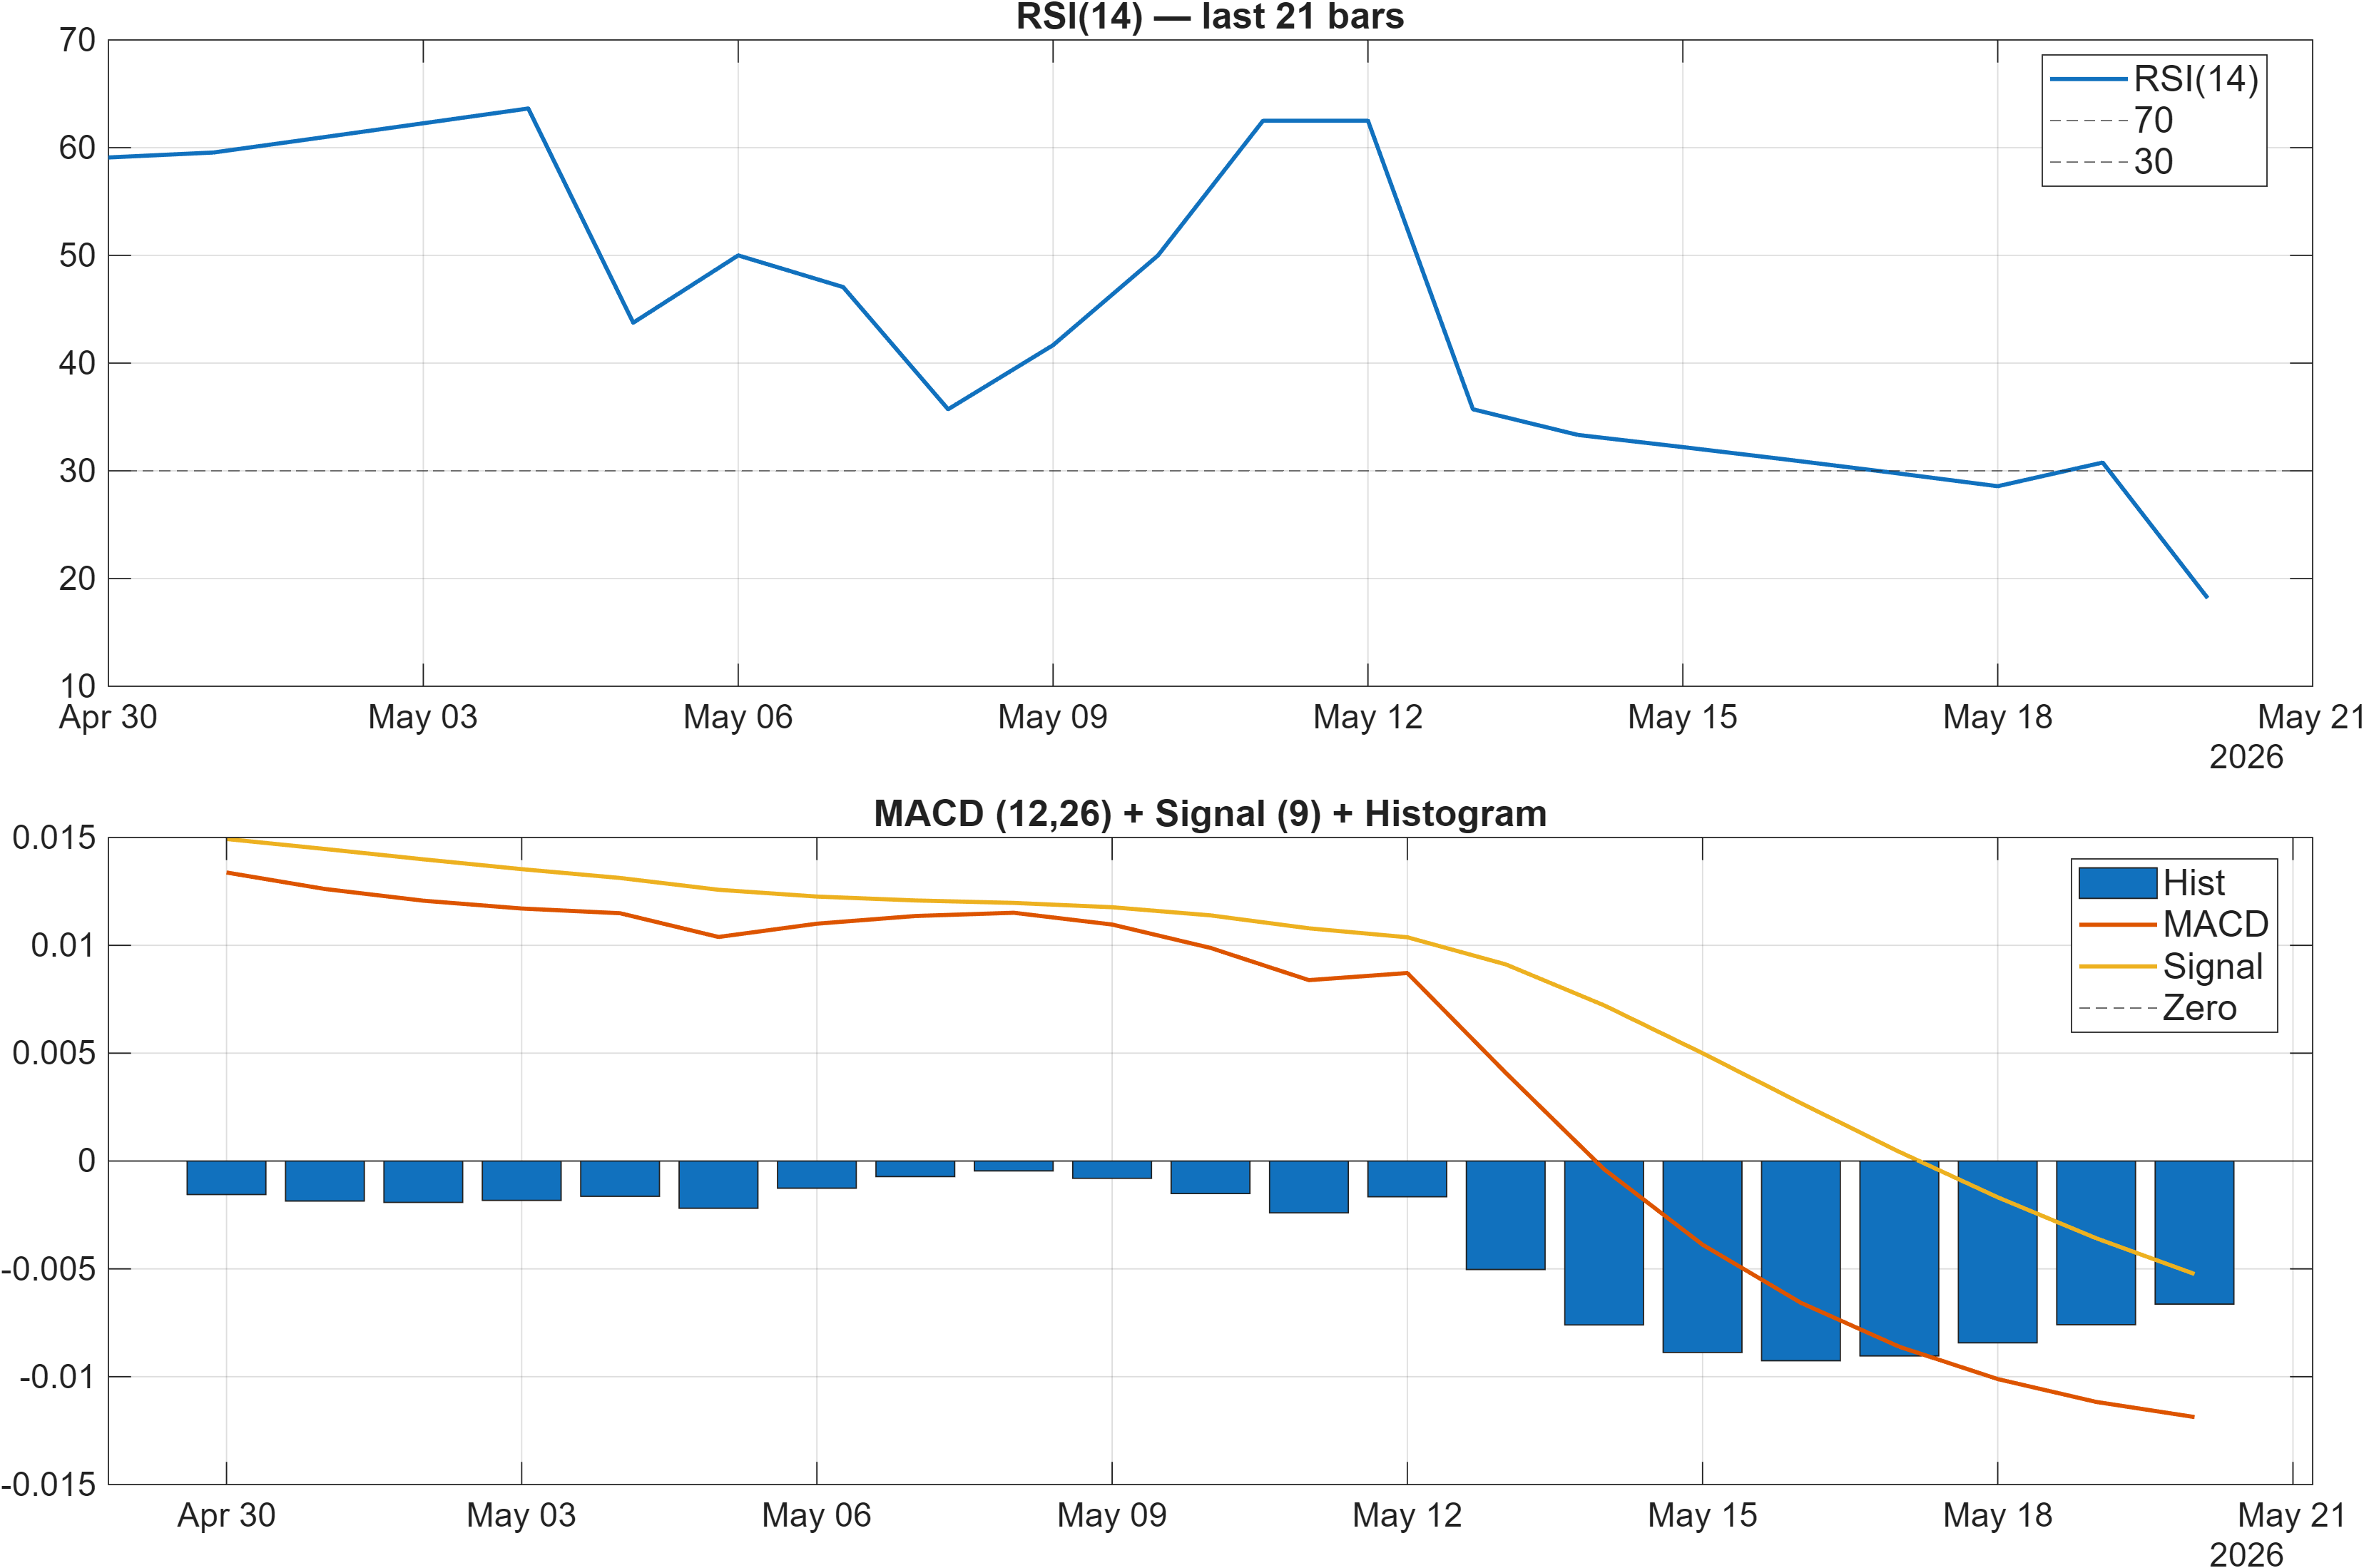
Interpretation: RSI bias = Bearish, MACD hist = -0.0066.
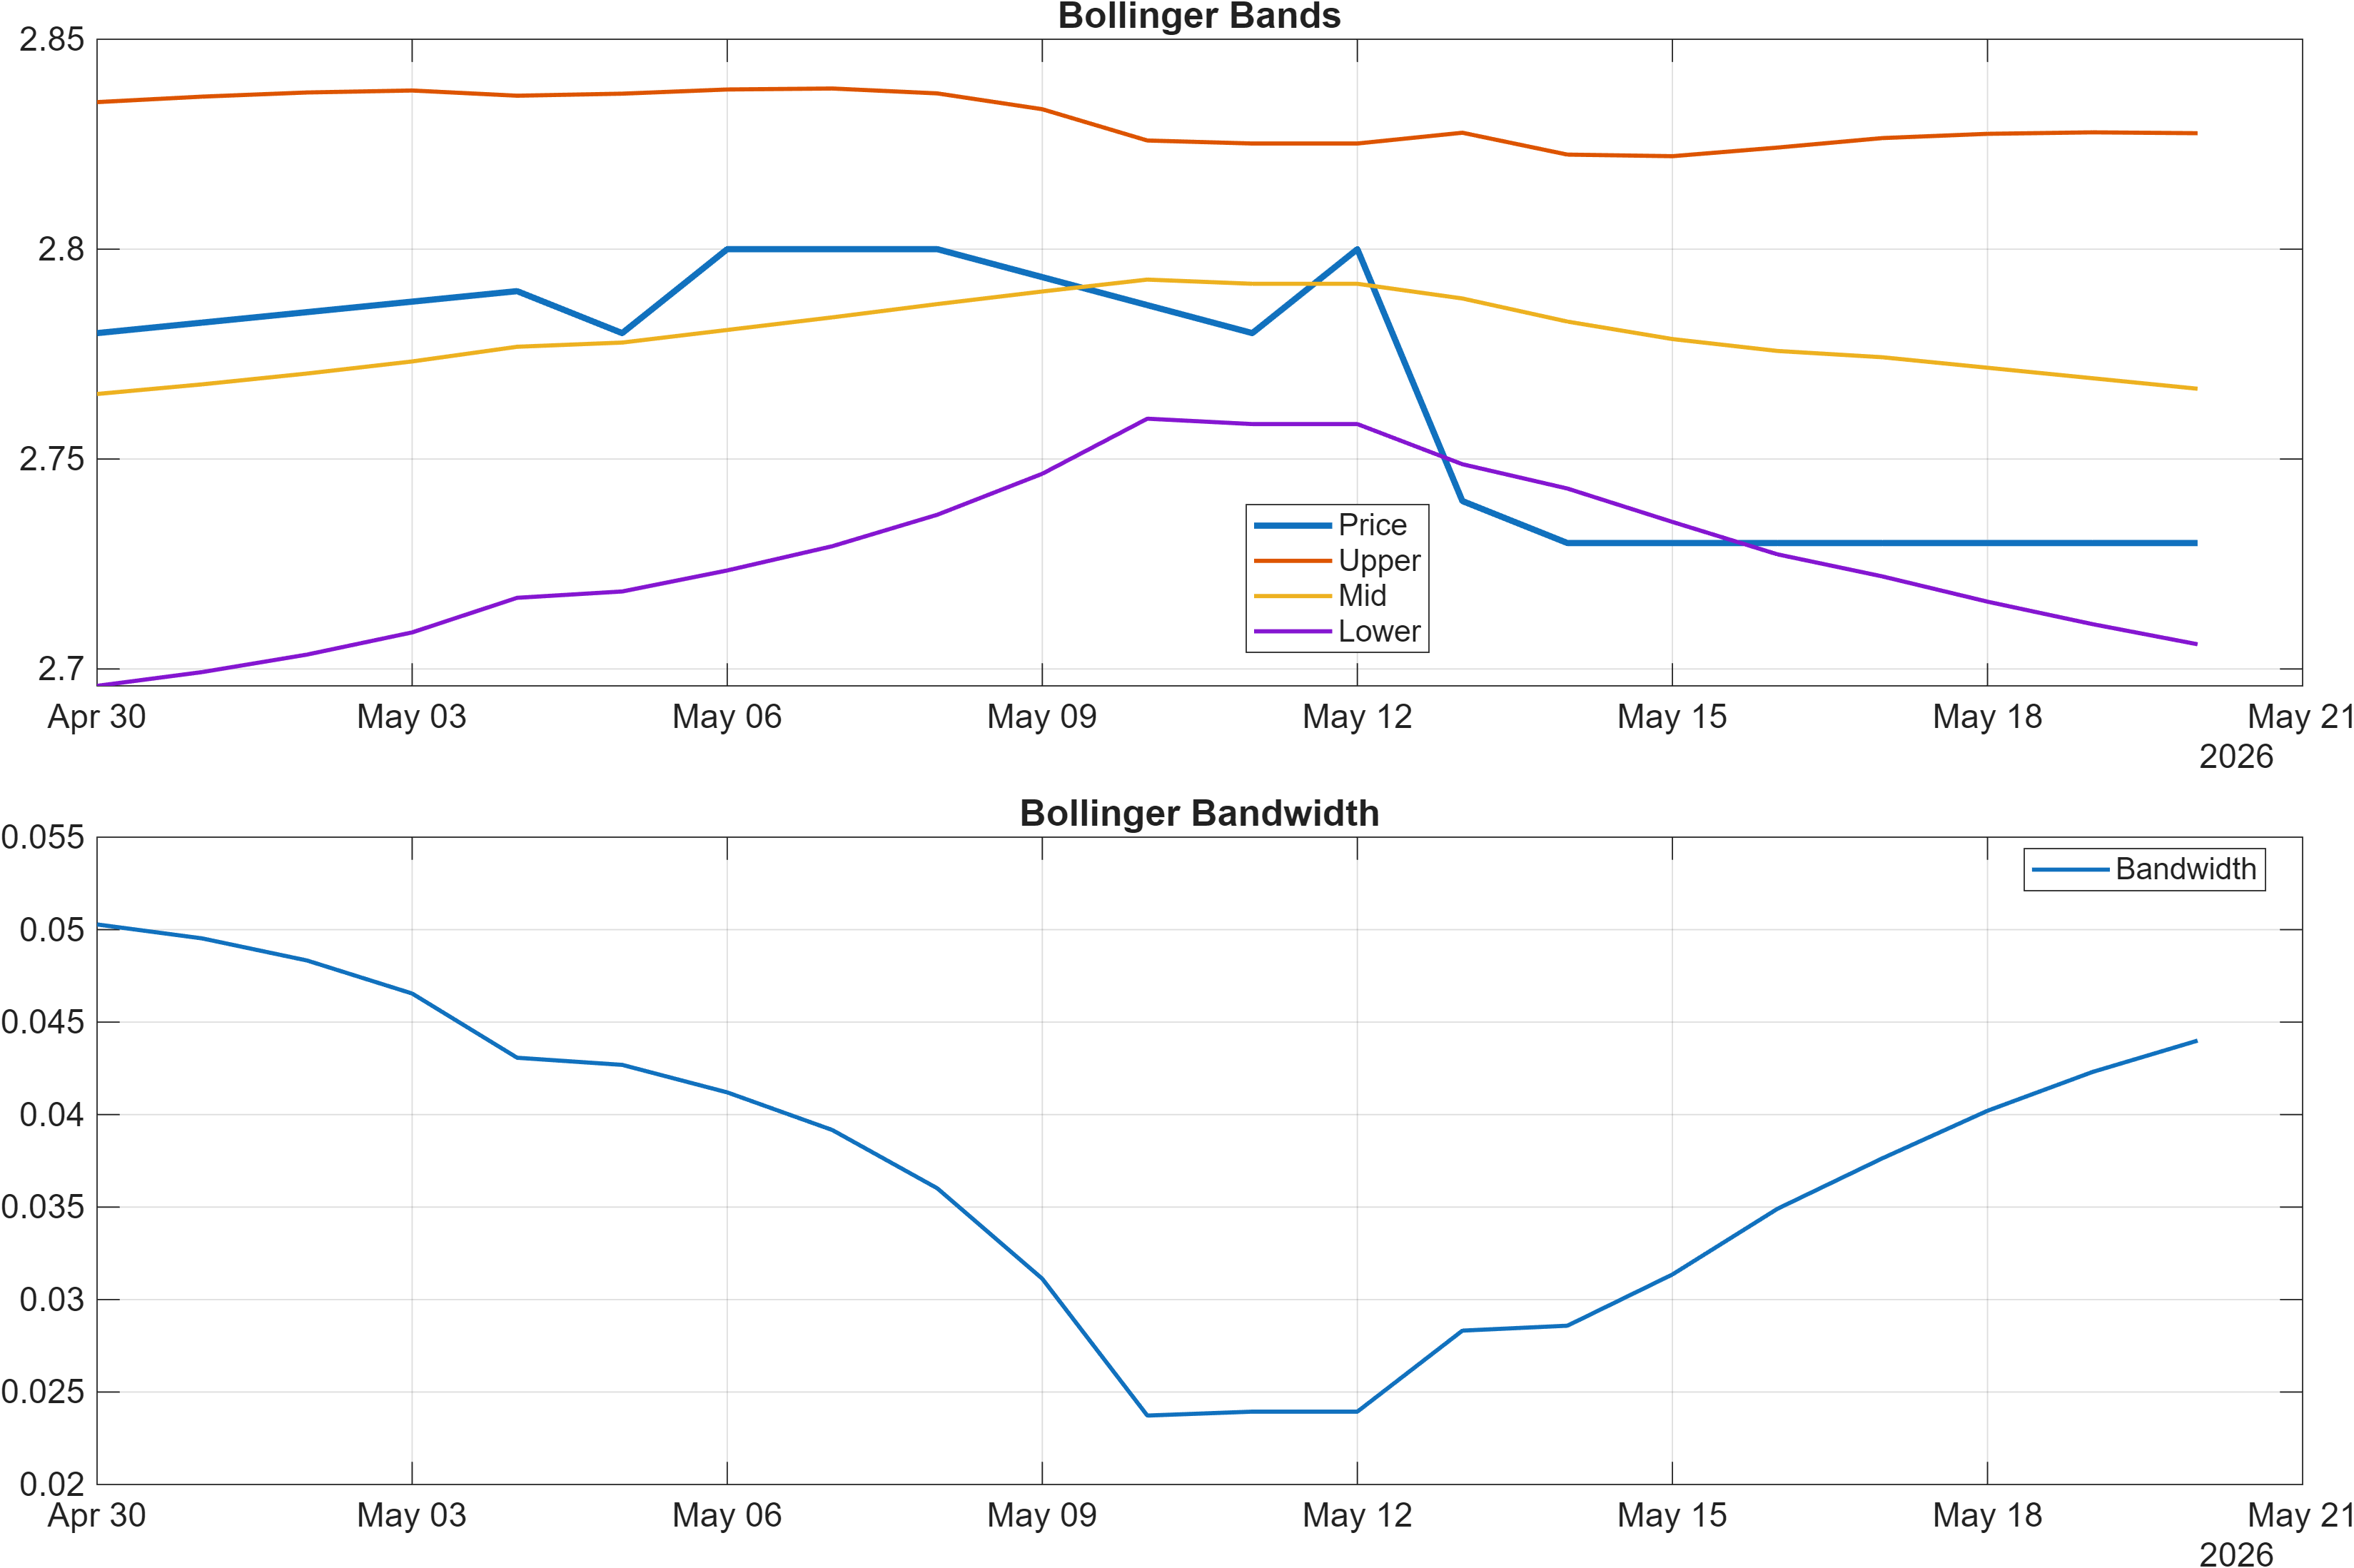
Interpretation: Bandwidth (volatility regime) latest = 0.0440.
Momentum: bearish compression with limited confirmation of reversal
Momentum inputs lean negative: RSI(14) at 18.18 is deeply depressed, while the MACD histogram (-0.006633) remains below zero. This pairing often appears during late-stage selloffs, but it is not, by itself, a reversal signal—oversold conditions can persist, especially when broader rank pressure (Daily #1236; Yearly #1290) remains unfavorable.
Volatility: controlled expansion rather than disorder
Bollinger bandwidth at 0.044 suggests a volatility regime that is present but not extreme. In market structure terms, that tends to support a “measured” swing environment: moves can be meaningful, yet price still frequently respects nearby decision zones such as 2.7000–2.8050. If volatility were materially higher, levels would be more prone to overshoot; here, they are more likely to function as reference rails.
Signal cross-check: when oversold is actionable
For MBWS.PA, the most credible momentum improvement would be a shift in the negative trend metrics (e.g., TS Mom(20) at -0.0525 and ROC(20) at -1.887) alongside price acceptance away from the lower boundary. Without that, oversold readings can simply describe weak bid depth rather than durable demand returning.
4) Support / Resistance zones
Support ~ 2.7000 | Resistance ~ 2.8050
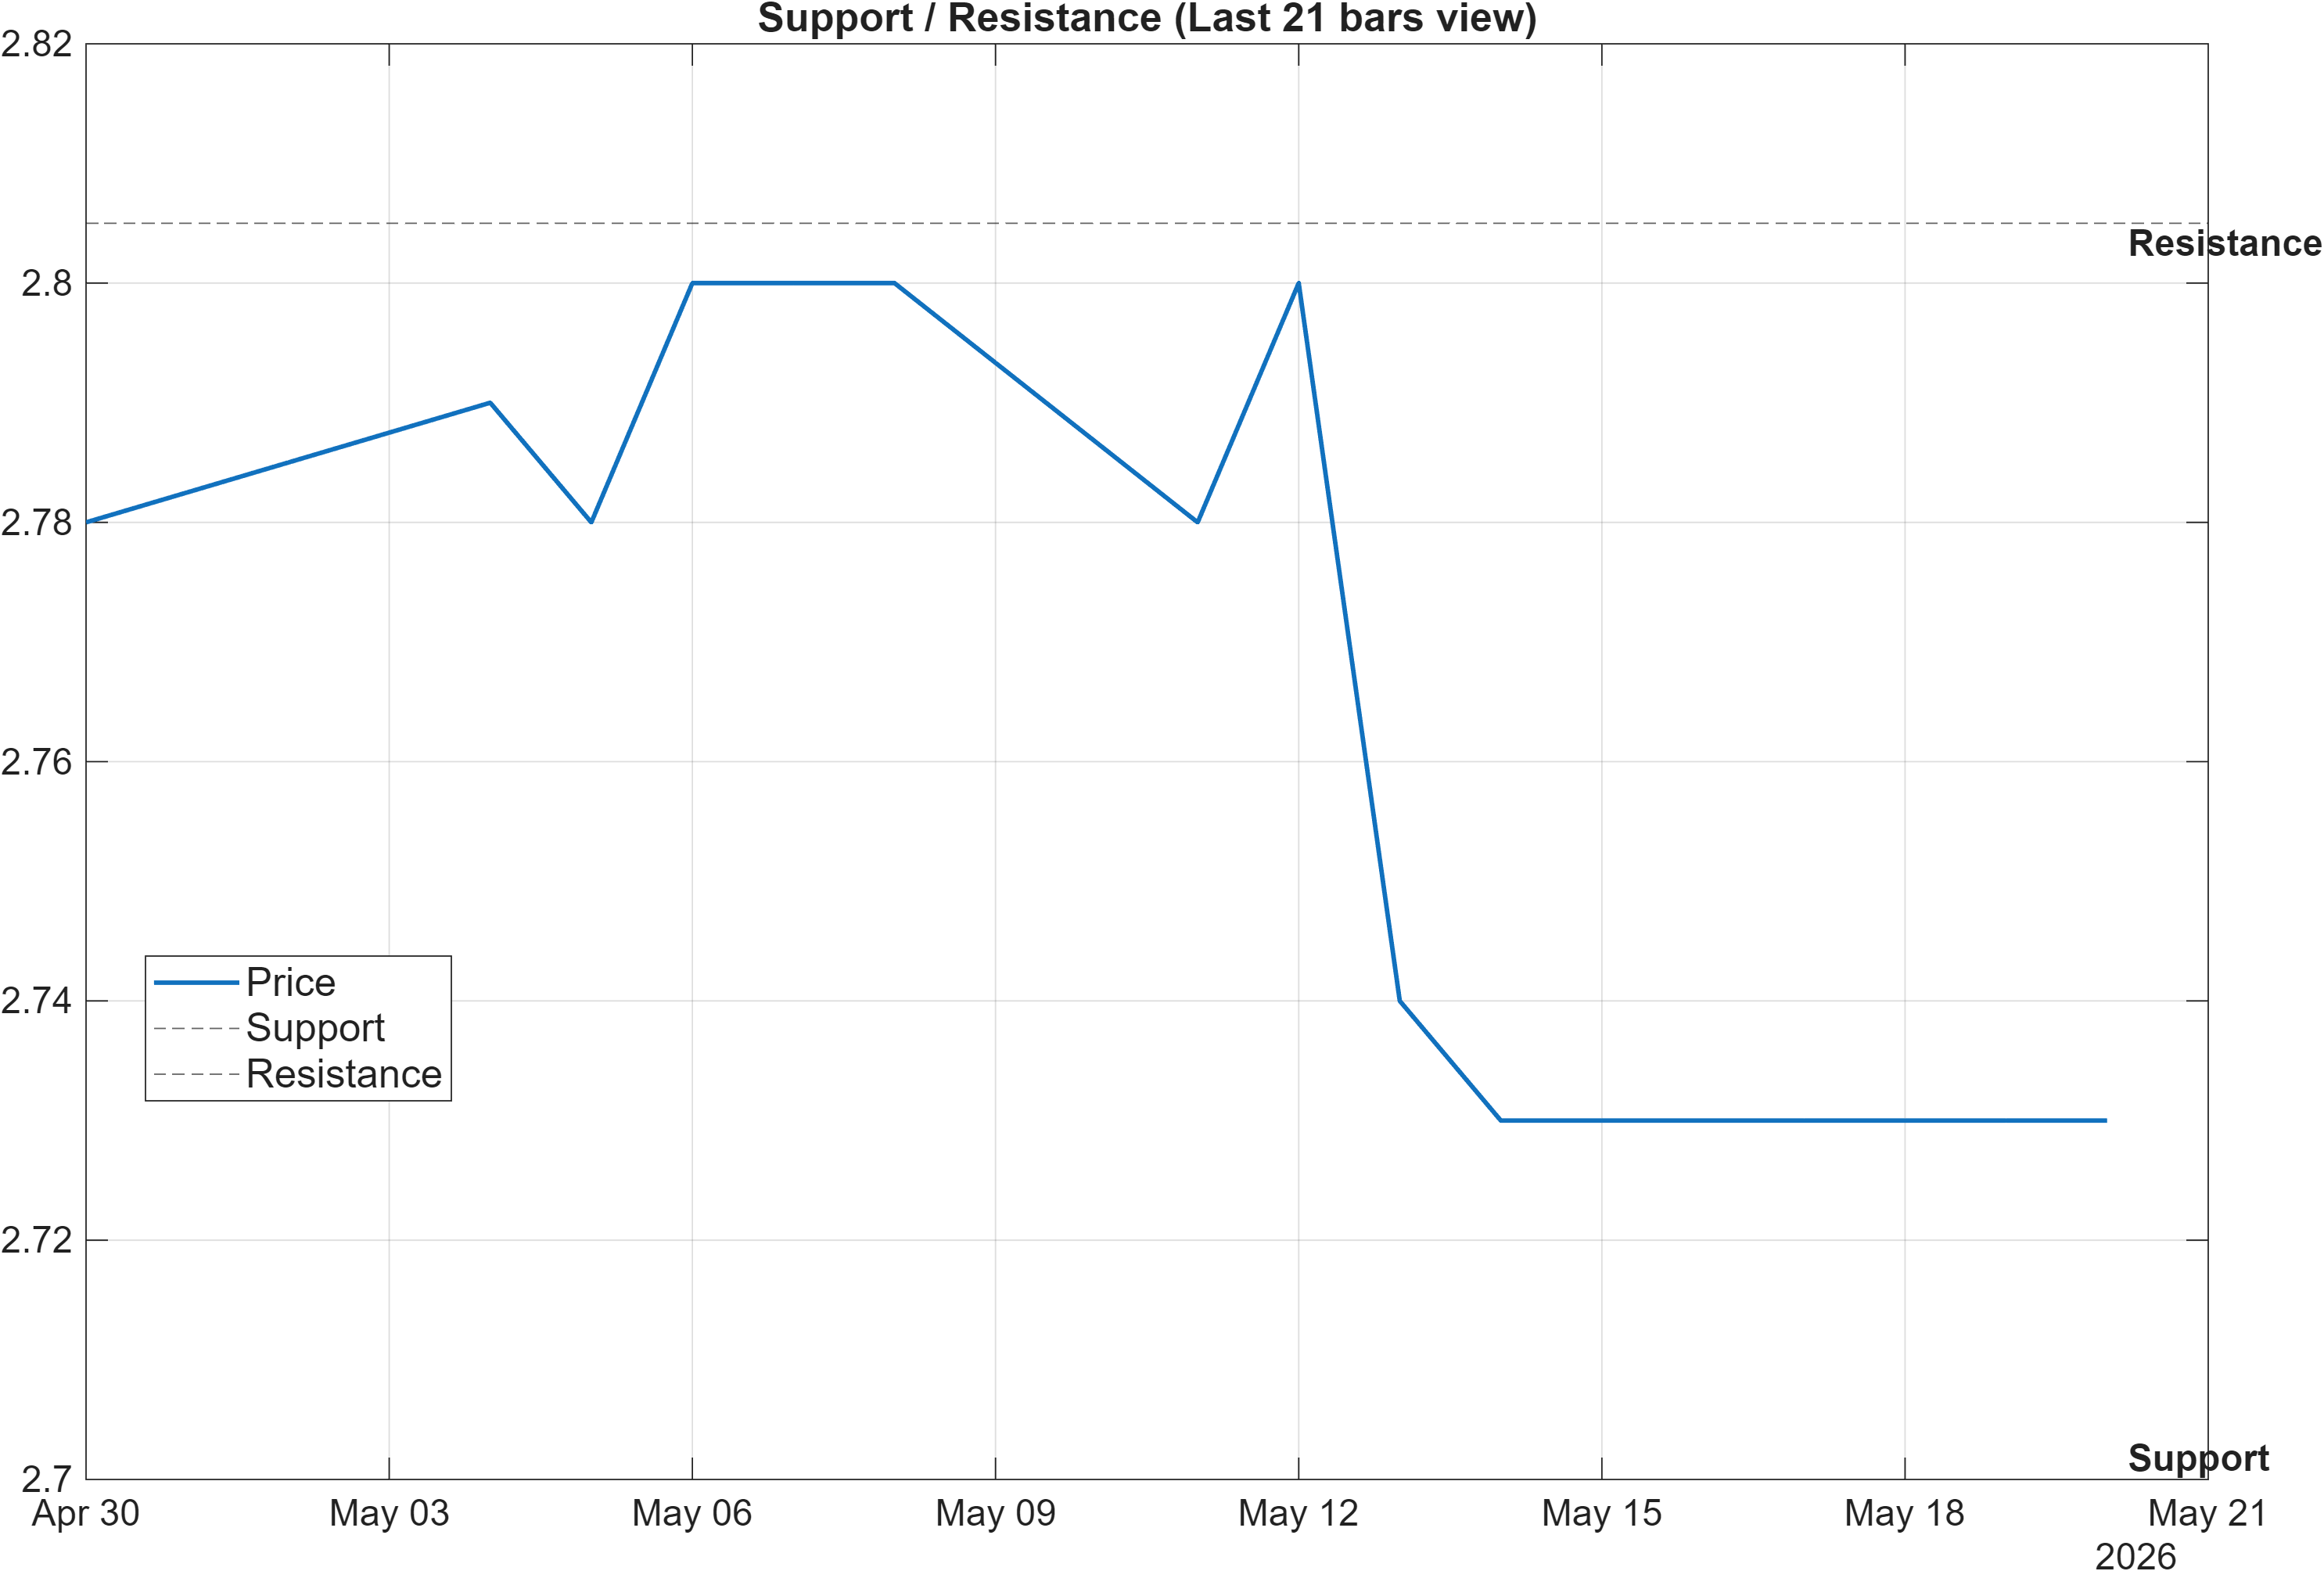
Scenario view: Break above resistance with volume → continuation. Close below support → signal deterioration risk.
Decision zones: defined range with asymmetric consequences
The chart structure is unusually clean: the market is framed by 2.7000 support and 2.8050 resistance, closely echoed by the 20-day extremes in the signal set (LLOW(20) at 2.7 and HHIGH(20) at 2.81). That alignment suggests the level map is not arbitrary—recent price discovery has repeatedly referenced the same boundaries.
Regime continuation vs transition: what a break would imply
A break above 2.8050 with volume would be a transition event: it would test whether bearish momentum readings are simply “oversold within a base,” or whether they represent persistent distribution. Conversely, a close below 2.7000 would introduce deterioration risk by pushing price beyond the area that has recently functioned as a lower rail—often a trigger for wider risk estimates and reduced confidence in mean reversion.
Micro-structure nuance: proximity and failed moves
The signal table flags MedPx vs Support at 0.02 as Bullish, which is consistent with price being close enough to support to attract tactical buying. However, proximity is not protection: if the tape repeatedly tests support without follow-through toward resistance, it can indicate weakening demand elasticity. In that case, the next meaningful information comes from how price behaves on a retest—especially if volatility (bandwidth 0.044) starts to expand during the move.
5) Quant Technical Dashboard (18 Signals)
KGNAI AI Technical Analysis Score (Deep Reinforcement Learning): Rank #848 out of 1417 (Rank 1 represents the strongest technical positioning and a higher probability of favorable price behavior. As ranks increase toward the maximum, the probability of favorable outcomes weakens and bearish positioning becomes more dominant.) | Label: Neutral | Score: -0.197
18-Signal Technical Confluence Score: -0.278 (Neutral)
Overall Technical Score (18-signal confluence + DRL rank blend): -0.254 (Neutral)
Note: The blended score reflects signal strength weighted against broader AI technical ranking, which may temporarily diverge.
Blended technical score breakdown: -0.254 (Neutral | Bull 4 / Bear 9 / Neutral 5)
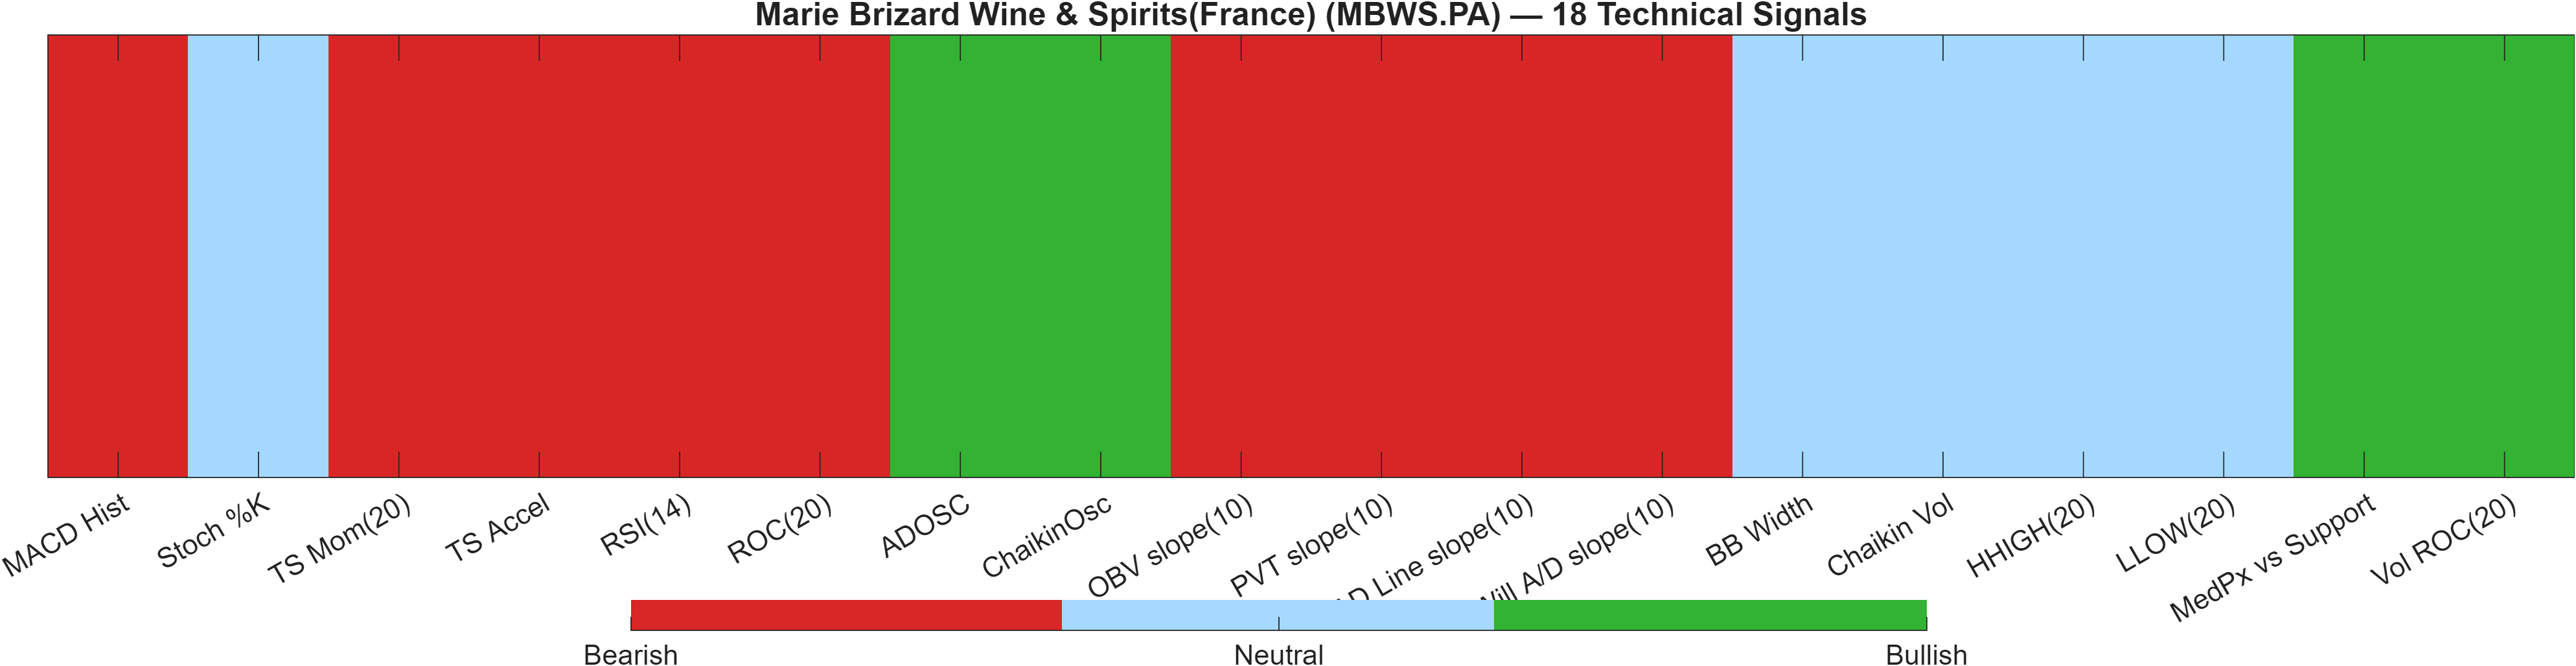
Signal balance: Neutral label, bearish skew underneath
The composite is labeled Neutral, but the internal distribution (Bear 9 vs Bull 4) indicates the neutrality comes from mixed magnitudes rather than broad agreement. This is consistent with a market that can stage short bounces while still carrying negative momentum and weak relative strength characteristics.
Momentum cluster vs accumulation cluster: a structured divergence
On the bearish side, momentum and trend signals dominate: RSI(14) 18.18, TS Accel -0.1017, and OBV slope(10) -8580 all reflect pressure and/or weak participation in the prevailing direction. Against that, there are constructive pockets in accumulation/flow, including ChaikinOsc 402.1 and ADOSC 50, plus Vol ROC(20) 40.74 flagged bullish. This divergence often appears when selling slows and tactical bids emerge, but the broader tape has not yet repaired.
Blended model read: why a mediocre rank can still matter
The Deep Reinforcement Learning technical rank is #848 of 1417 with a score of -0.197 (Neutral). That positioning is not extreme, which can happen when price is statistically “stable” in a range even if directional indicators look weak. However, with the blended overall technical score at -0.254, the higher-level takeaway is that the system still treats MBWS.PA as more vulnerable to failed rallies unless multiple independent groups (momentum, trend, and participation) begin to align.
Signal table (Bull/Bear/Neutral)
| Indicator | Value | Signal |
|---|---|---|
| MACD Hist | -0.006633 | Bearish |
| Stoch %K | 30 | Neutral |
| TS Mom(20) | -0.0525 | Bearish |
| TS Accel | -0.1017 | Bearish |
| RSI(14) | 18.18 | Bearish |
| ROC(20) | -1.887 | Bearish |
| ADOSC | 50 | Bullish |
| ChaikinOsc | 402.1 | Bullish |
| OBV slope(10) | -8580 | Bearish |
| PVT slope(10) | -122.8 | Bearish |
| AD Line slope(10) | -732.6 | Bearish |
| Will A/D slope(10) | -0.07 | Bearish |
| BB Width | 0.044 | Neutral |
| Chaikin Vol | -24.02 | Neutral |
| HHIGH(20) | 2.81 | Neutral |
| LLOW(20) | 2.7 | Neutral |
| MedPx vs Support | 0.02 | Bullish |
| Vol ROC(20) | 40.74 | Bullish |
Interpretation: Indicator-level signals form the base confluence, which is then adjusted using a separate AI-driven technical ranking model. The final technical score summarizes this combined view.
6) News sentiment + extractive gist
Sentiment score (avg): 0.126 | Positive: 33% | Neutral: 67% | Negative: 0%
KGNAI AI News Sentiment Score (normalized -1 to +1): 0.87 (as of 2025-10-24) | Label: Bullish | Overall news score: 0.88
Positive Developments
Recent coverage across major financial outlets indicates a generally constructive operational narrative, centered on distribution footprint and market access. The sentiment mix shows 33% Positive and 0% Negative with an average score of 0.126, while the normalized news score prints 0.87 with a Bullish label. The most supportive theme is strategic partnering and distribution expansion: these items typically read as incremental catalysts for brand reach and channel penetration rather than immediate price drivers. In parallel, the availability and filing of formal reporting documentation is framed as procedural transparency—rarely a bullish driver by itself, but it can improve informational confidence. Taken together, the news tone provides a modest tailwind to perception; however, the technical backdrop still requires price confirmation, especially given the resistance-defined structure near 2.8050.
Neutral / Mixed Developments
A meaningful share of the flow is informational, consistent with the 67% Neutral reading. The neutral component can still matter because it increases the frequency of “non-catalyst” days where price is driven more by liquidity, positioning, and broader tape effects than by new fundamentals. This aligns with the current technical state: confluence is Neutral (-0.278) even as momentum readings are bearish, a combination often seen when a market is digesting prior moves rather than repricing decisively. In that environment, news provides context but does not necessarily override the level map—support near 2.7000 and resistance near 2.8050 remain the practical decision zones.
Negative / Risk Signals
The dataset shows 0% Negative items, but risk is still present in how the market is reacting. A bullish-labeled normalized score (0.87) alongside bearish technical momentum (e.g., RSI 18.18 and MACD histogram -0.006633) can indicate a sentiment–price mismatch: constructive narratives are not yet converting into sustained bid strength. The most relevant risk signal is therefore structural rather than headline-driven—namely, the possibility of repeated failed rallies into resistance and eventual pressure on support. If price acceptance slips below 2.7000, the news tone would become secondary to the technical deterioration risk and any volatility expansion (bandwidth 0.044) could amplify move size.
What to monitor next
- Whether price can reclaim and hold above the short-term trend reference implied by “Close vs MA50 = Bearish,” while approaching 2.8050.
- Momentum repair: watch for stabilization and recovery signals alongside the depressed RSI(14) 18.18 and negative MACD histogram -0.006633.
- Support integrity: any close below 2.7000 would increase the probability that the range regime is breaking down.
7) Sources
Not available in the provided data.
You may also like: How KGNAI AI ranks instruments across global markets
Disclaimer: KGNAI provides AI-generated analytics and educational market commentary only. This is not financial advice. Markets involve risk. Always do your own research.