
INDT.ST — Indutrade AB (Sweden) | 17-May-2026 | Ranks constructive, technicals still pressured
KGNAI’s cross-sectional ranks for Indutrade AB (INDT.ST) remain strongly constructive across time horizons, with the Yearly rank at #6 and the 6-Monthly rank at #41 out of a 1417-instrument European universe. However, the price/technical layer is notably less aligned: the moving-average read is flagged bearish (close vs MA50 and MA50 vs MA200), while the blended technical framework also leans negative with an Overall Technical Score of -0.425 and a DRL technical rank of #1161. Momentum indicators show mixed behavior—RSI(14) at 28.33 suggests oversold pressure even as MACD histogram at 0.0178 indicates a tentative stabilization attempt. Volatility appears contained with Bollinger bandwidth at 0.0806, elevating the importance of nearby decision zones: support ~192.3500 and resistance ~252.1000.
- Rank stance: Short / Mid / Long all Bullish (notably Yearly #6; Daily #64).
- Technical confluence: Bearish (Overall Technical Score -0.425; DRL rank #1161).
- Key levels: Support ~192.3500 | Resistance ~252.1000.
- News sentiment bias: Neutral (avg sentiment 0.000; distribution 100% neutral).
- Confirmation / invalidation: A break above 252.1000 with volume supports continuation; a close below 192.3500 increases deterioration risk.
KGNAI evaluates assets using large cross-sectional datasets built from millions of structured data points. Inputs incorporate fundamental metrics, technical structures, and systematically processed news sentiment. Statistical models, machine learning, and AI frameworks are used to assess relative positioning, signal alignment, and probabilistic behavior across broad universes.
- Ranks are comparative across the tracked universe, not absolute price targets.
- Confluence reflects alignment among independent signal groups.
- Support/resistance levels are probabilistic decision zones, not guarantees.
- Sentiment provides contextual bias within the broader analytical framework.
KGNAI Signal + Technical Snapshot + News Sentiment Digest
As of: 17-May-2026
Ticker: INDT.ST
1) KGNAI AI Analysis
Region: EUROPE
Total universe size: 1417 ranked instruments
- Daily rank: #64 out of 1417 — Bullish
- Weekly rank: #248 out of 1417 — Bullish
- Monthly rank: #253 out of 1417 — Bullish
- 3-Monthly rank: #177 out of 1417 — Bullish
- 6-Monthly rank: #41 out of 1417 — Bullish
- Yearly rank: #6 out of 1417 — Bullish
The rank stack is uniformly constructive, but the shape of the curve matters. INDT.ST sits in the top decile on a yearly basis (#6 of 1417) and remains strong over six months (#41), suggesting durable relative strength versus the broader European universe. Shorter horizons soften but remain supportive: the daily rank (#64) contrasts with a weaker weekly read (#248) and similar monthly positioning (#253), implying a near-term consolidation phase inside a longer-term leadership profile.
This is a classic alignment vs divergence setup: the model’s longer-window behavior is favorable, while shorter-window rankings appear less forceful. In practice, this often coincides with either (a) a controlled pullback within an established regime, or (b) a transition period where price-based technicals need to “catch up” to the persistent cross-sectional strength. The broad consistency of Bullish labels across every horizon (Daily through Yearly) reduces the likelihood that the long-term placement is an isolated outlier.
The term view remains Bullish across short-, mid-, and long-term classifications, but the dispersion between #6 (Yearly) and the mid-pack weekly/monthly readings argues for monitoring whether the near-term rank improves back toward the upper quartile. From a process standpoint, the ranks provide the “relative positioning” layer; subsequent sections test whether technical structure, momentum, and key levels confirm that positioning.
Term view: Short-term: Bullish. Mid-term: Bullish. Long-term: Bullish.
Want the full universe and complete rank tables? Unlock full access on KGNAI: https://www.kgnai.com/pricing
2) Price & trend overview
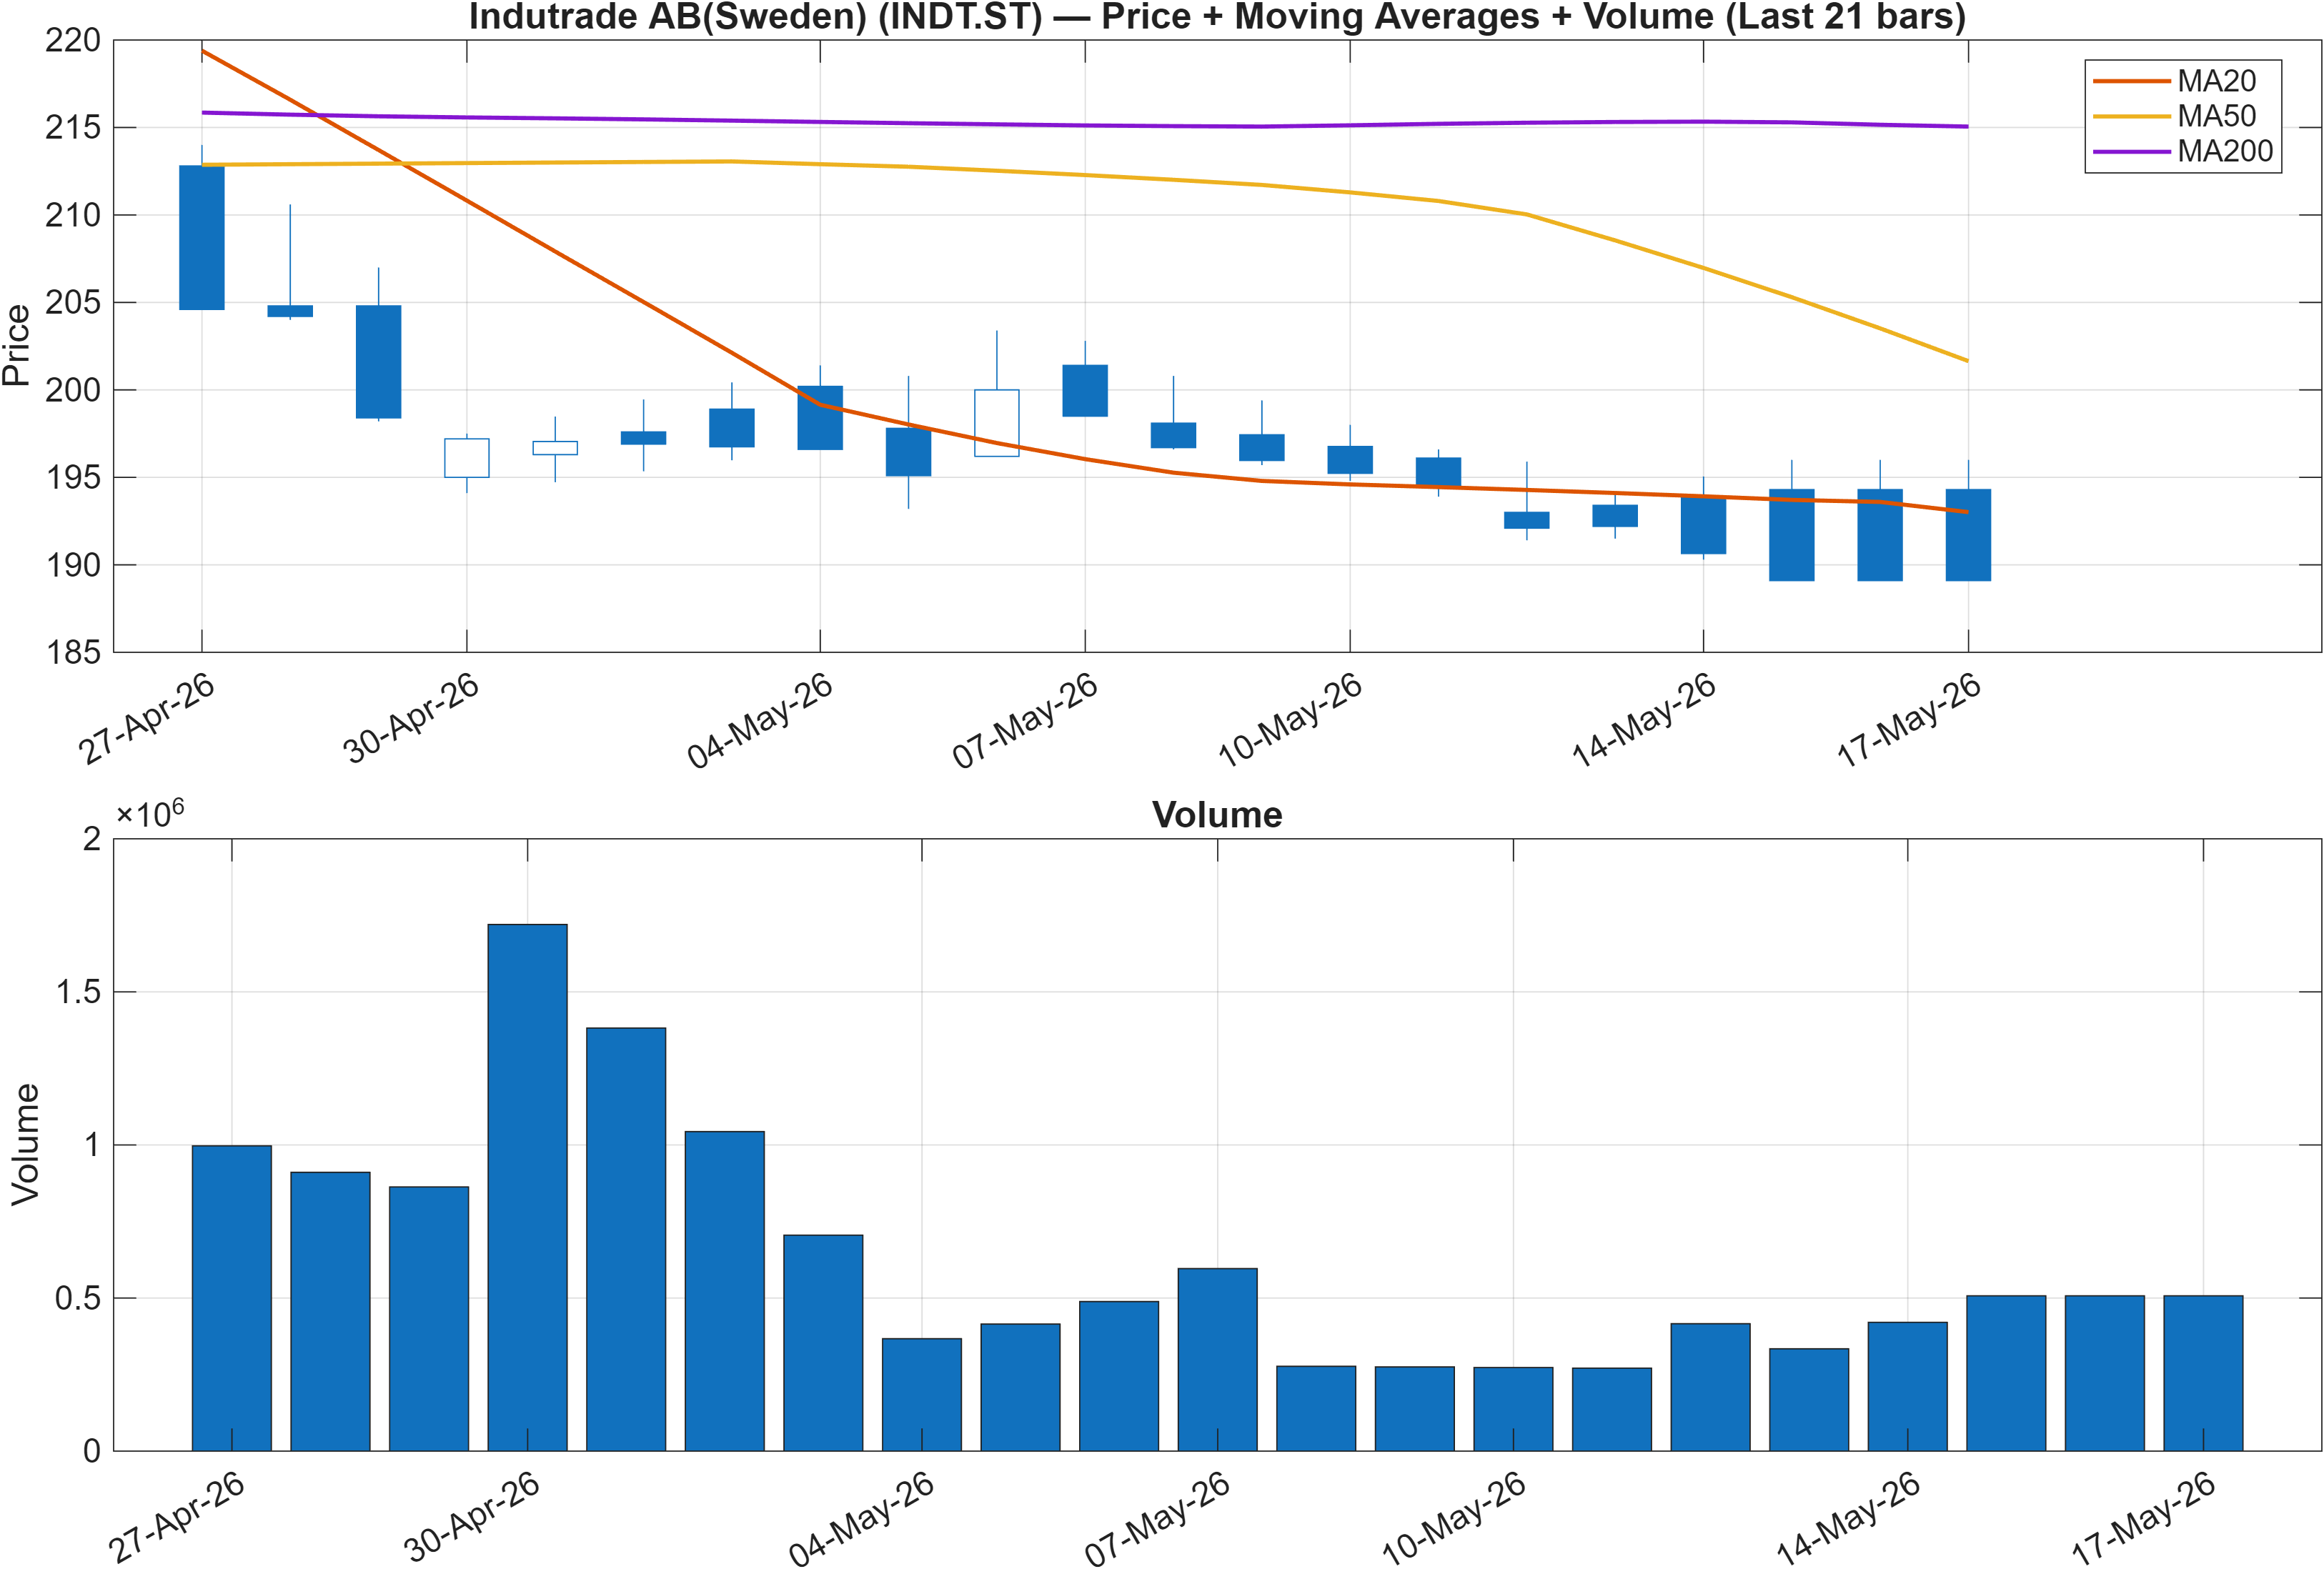
The moving-average framework is currently flagged as bearish on two independent checks: close vs MA50 and MA50 vs MA200 are both marked bearish. That combination typically defines a market that is still working through a drawdown rather than one already back in a stable uptrend. The tension is notable because the ranking layer (including the Yearly #6 and Daily #64) remains constructive, implying that relative performance may be holding up better than the raw trend condition suggests.
When rank strength persists while moving averages remain negatively aligned, attention shifts to trend persistence vs exhaustion. The question is less about “direction” and more about whether the downside impulse is losing force. Early stabilization tends to appear first in momentum and participation metrics before it resolves in the moving-average stack. Here, later sections show a small positive MACD histogram (0.0178) alongside a depressed RSI(14) of 28.33, a combination that can occur around late-stage pullbacks—provided price respects key support.
Volume is best interpreted contextually rather than in isolation. The scenario language in the levels section is explicit: a break of resistance should ideally be paired with volume expansion. That is relevant because the signal table includes a materially negative Vol ROC(20) of -44.29, indicating that recent volume change has not been supportive of aggressive upside follow-through. In other words, the trend picture is not yet “clean,” and any improvement would ideally show up as better participation as price re-approaches decision zones.
Interpretation: Close vs MA50 = Bearish, MA50 vs MA200 = Bearish.
3) Momentum & volatility dashboard
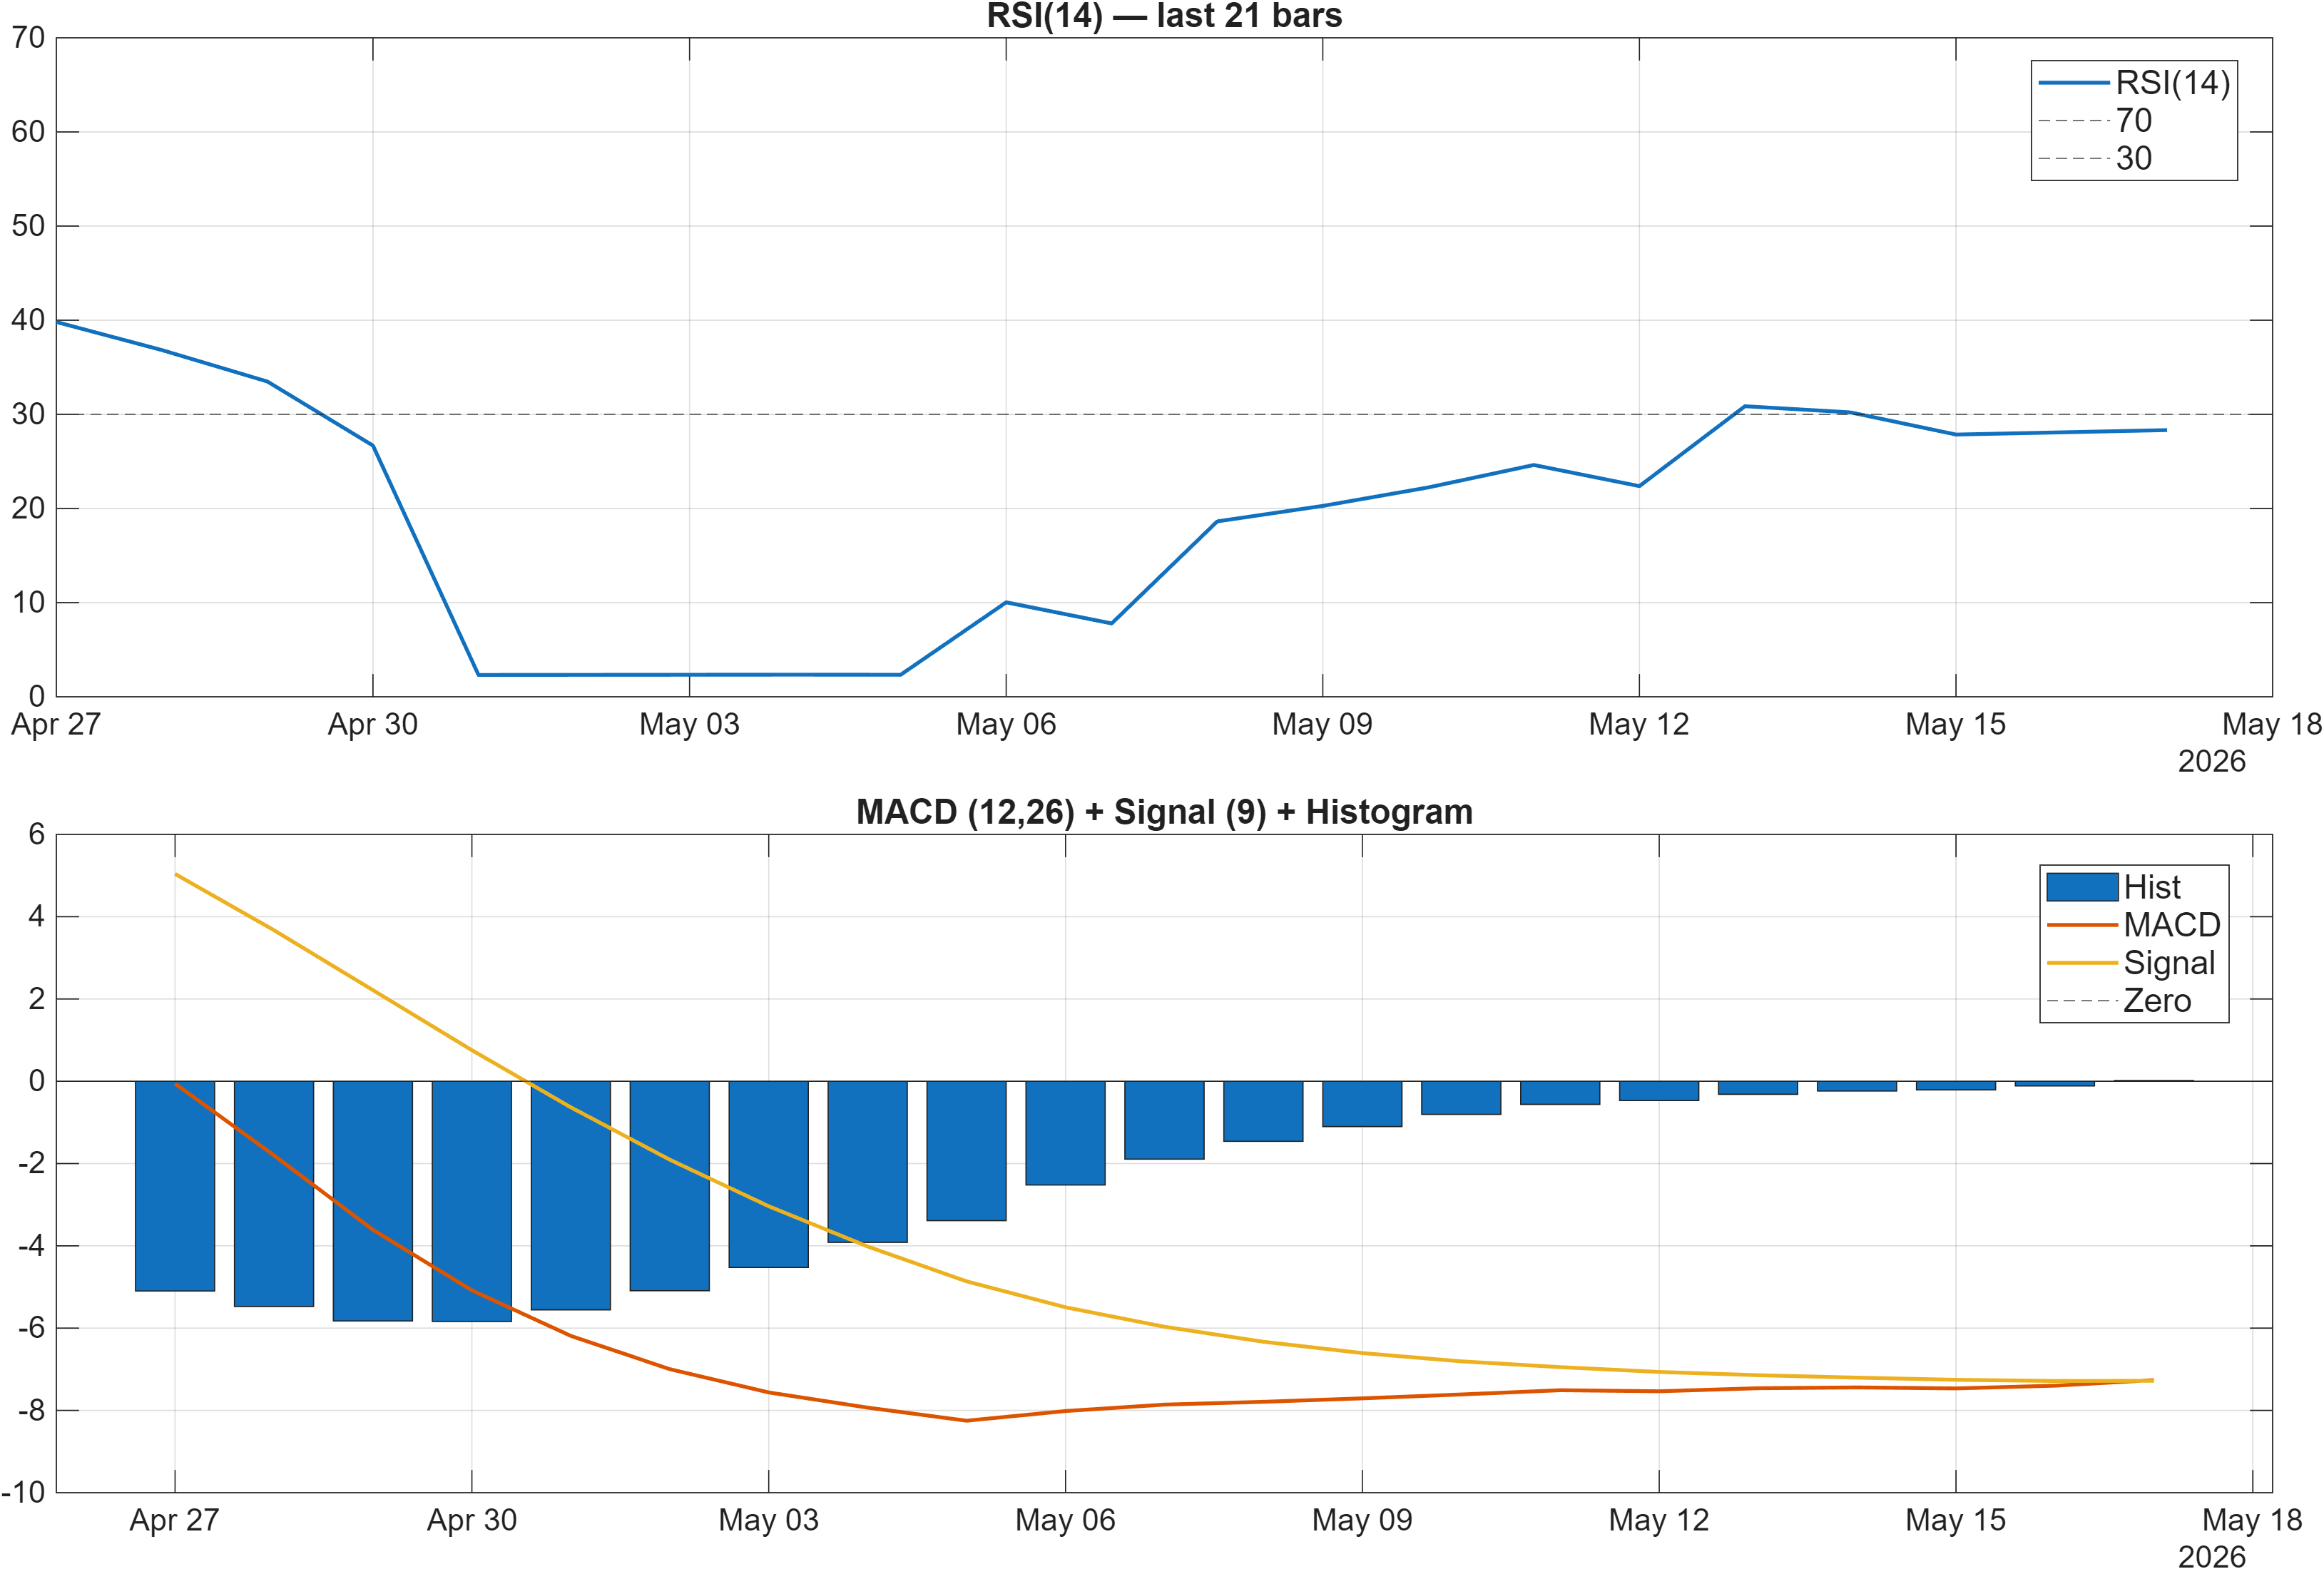
Momentum is sending a split message. On one hand, RSI(14) at 28.33 is flagged bearish and sits in a region often associated with oversold conditions rather than trend strength. On the other hand, MACD histogram at 0.0178 is marginally positive, suggesting downside momentum may be decelerating even if the broader trend has not repaired. This is a typical compression pattern: the market can stop going down faster before it starts going up consistently.
Additional momentum and rate-of-change measures skew negative: ROC(20) at -7.395, TS Mom(20) at -15.1, and TS Accel at -0.9 reinforce that the prevailing impulse over the last measured window remains to the downside. When several momentum gauges agree, the more informative question becomes whether the market is approaching a point where those readings can mean-revert without breaking structure—particularly around support (192.3500).
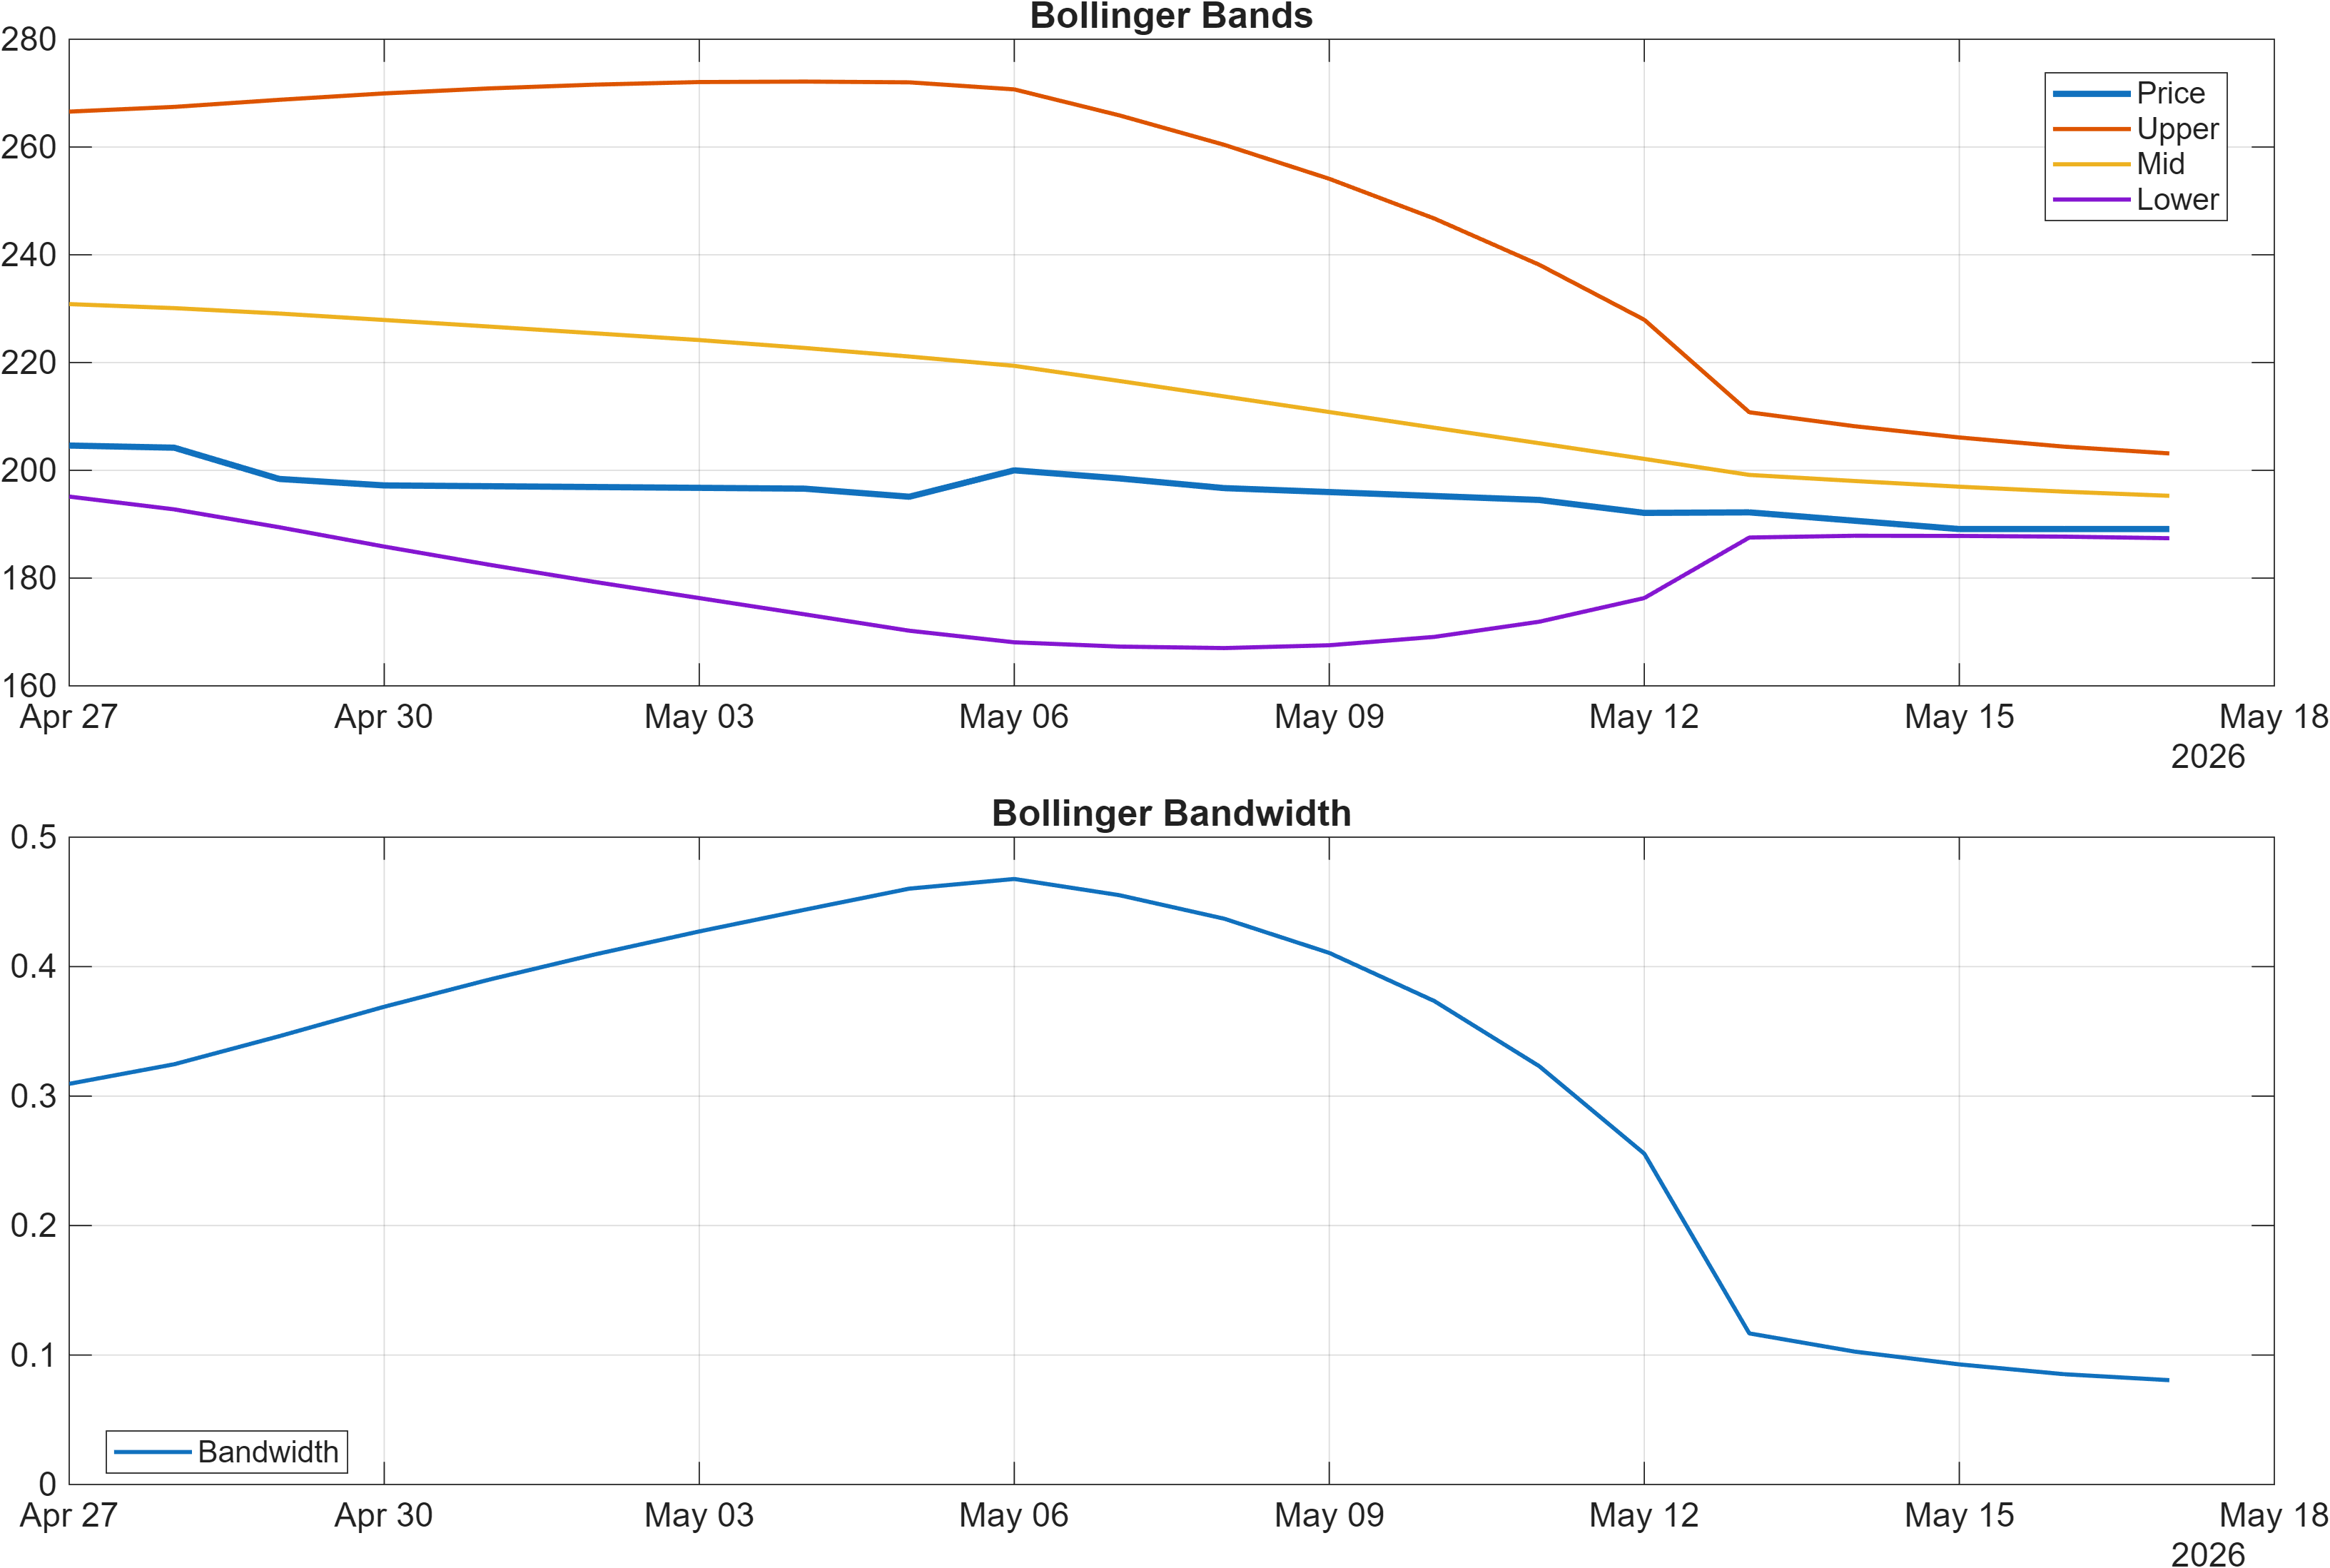
Volatility, as proxied by Bollinger bandwidth, is relatively contained at 0.0806. A lower bandwidth regime often shifts the market’s “edge” away from wide swings and toward level-driven outcomes—breaks, holds, and failed moves around established zones. With volatility not elevated, the next informative change is typically an expansion phase, where bandwidth widens alongside price direction. If bandwidth begins to expand while price remains below the MA50/MA200 structure, it can signal renewed downside pressure; if it expands while reclaiming levels, it can confirm a transition out of the pullback regime.
Interpretation: RSI bias = Bearish, MACD hist = 0.0178.
Interpretation: Bandwidth (volatility regime) latest = 0.0806.
4) Support / Resistance zones
Support ~ 192.3500 | Resistance ~ 252.1000
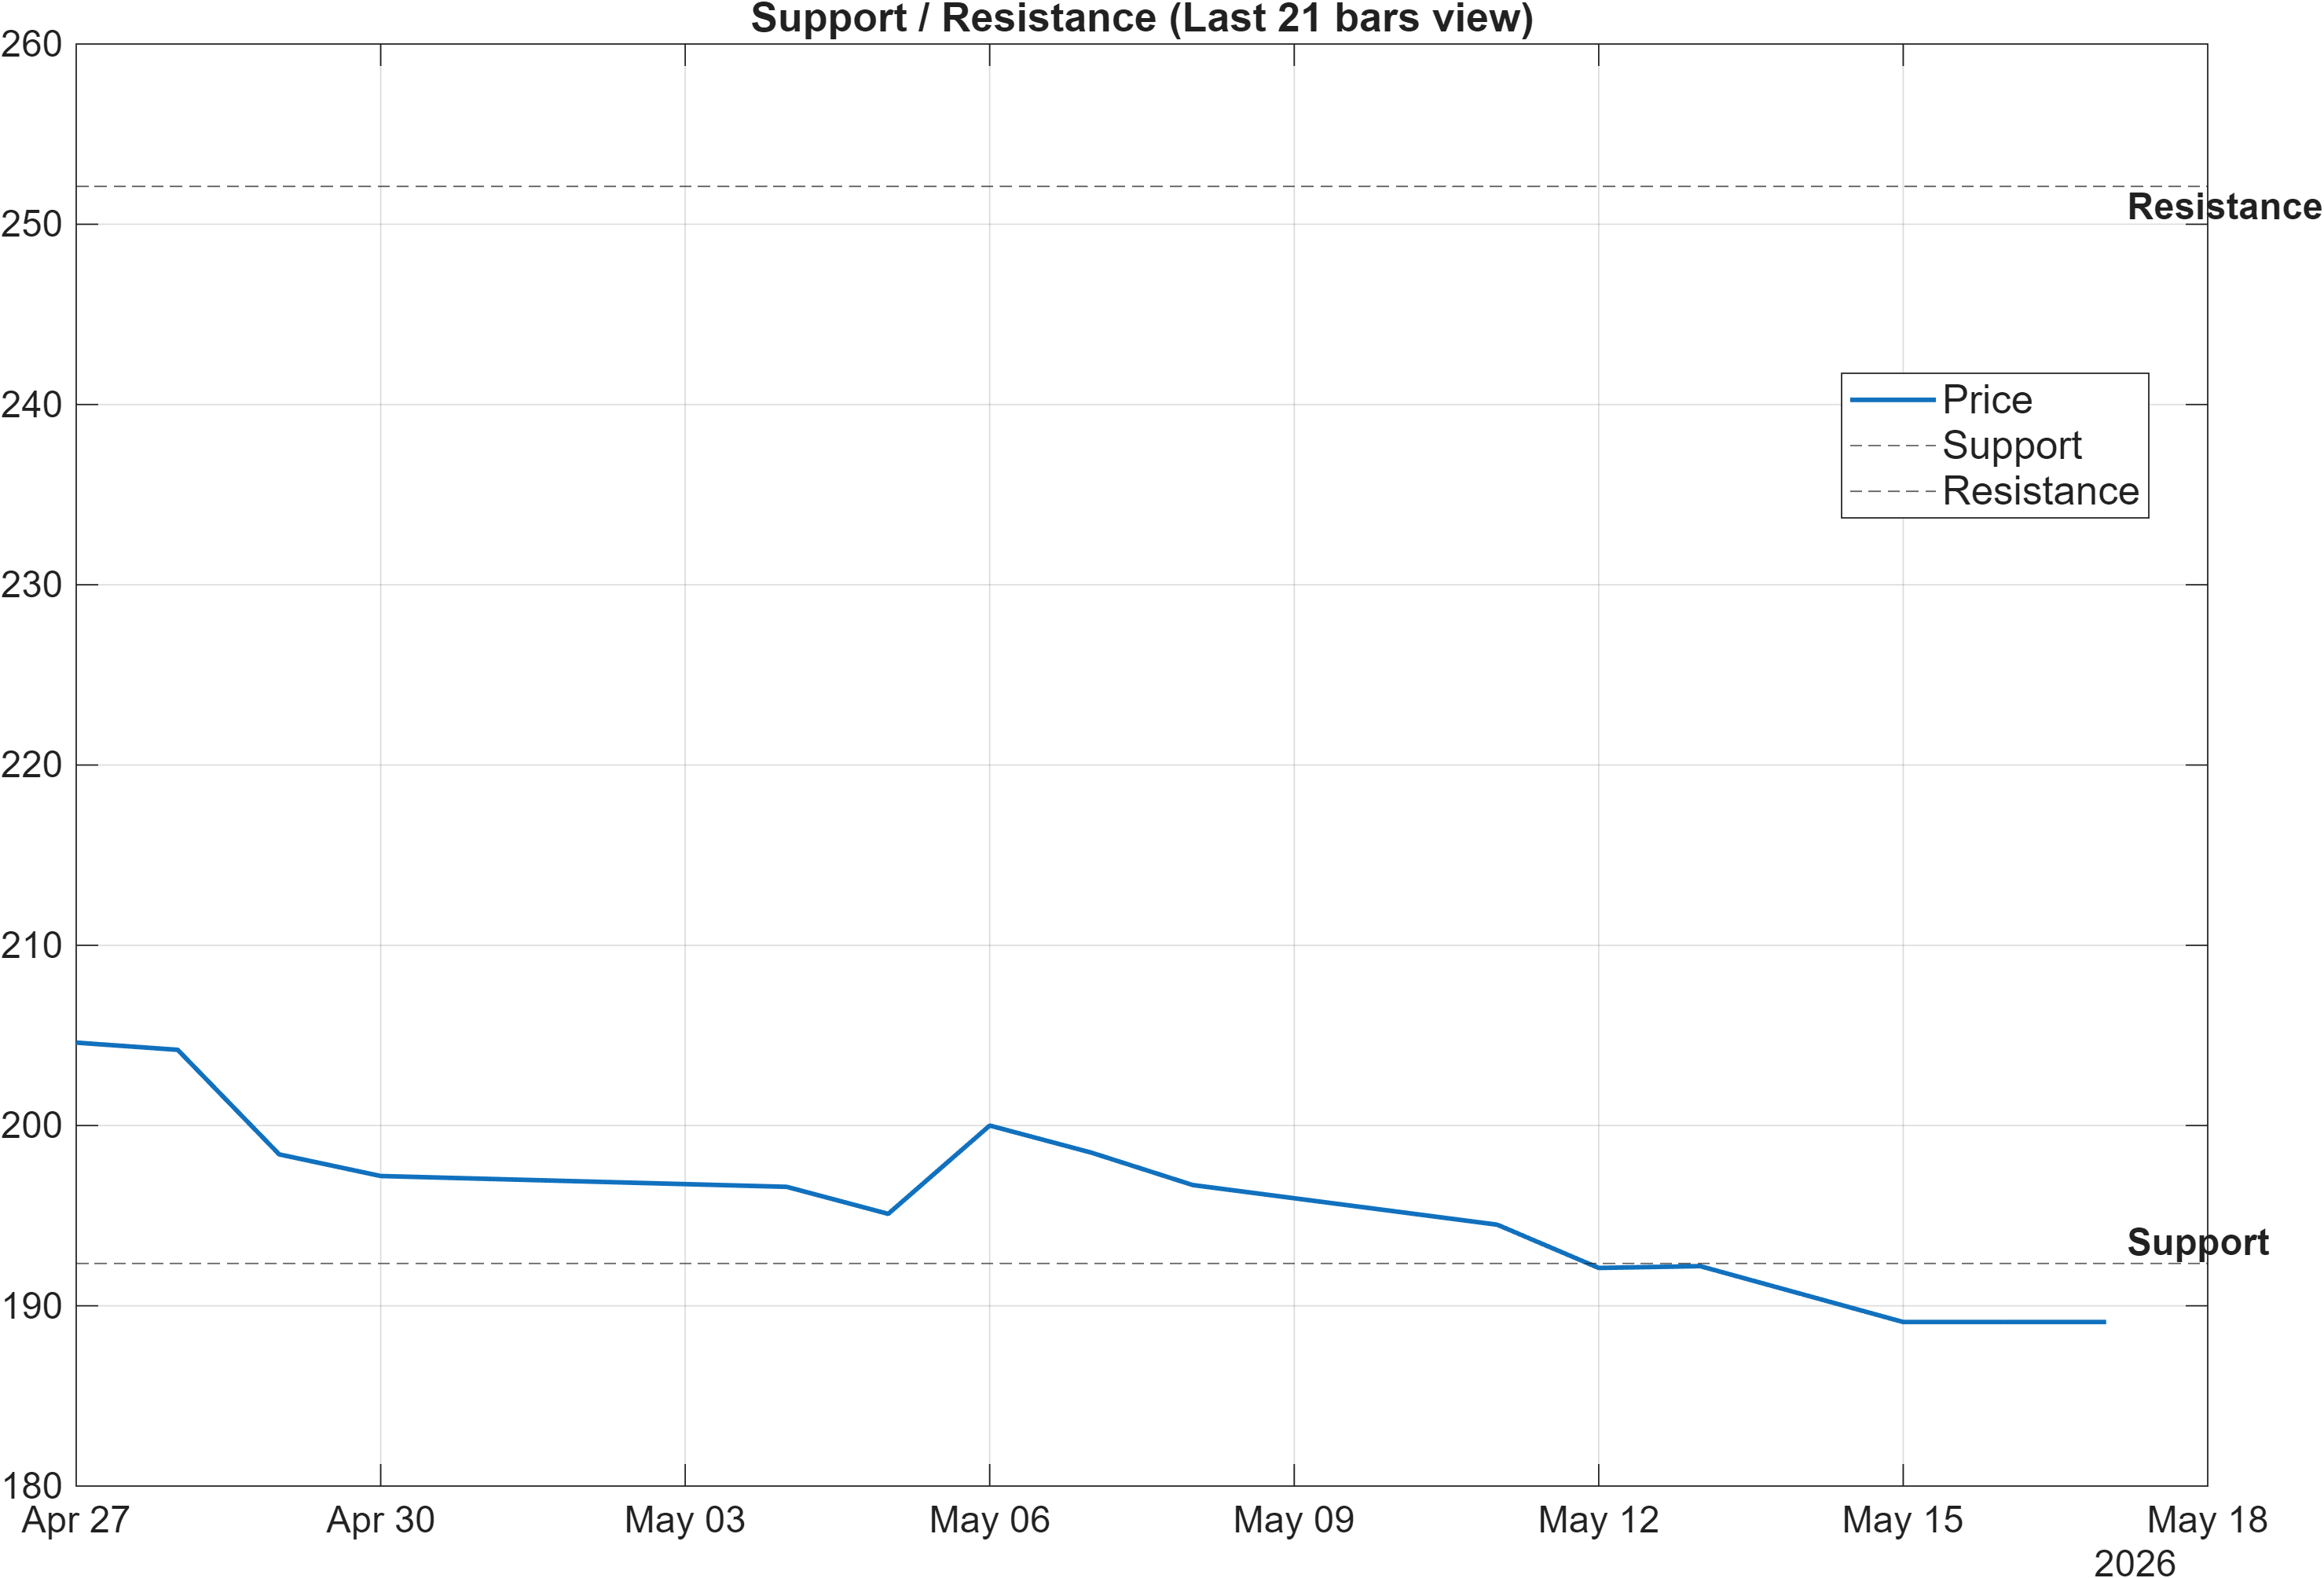
The level map provides a clean framework for resolving the current rank–technical divergence. With support ~192.3500, the market is effectively operating with a clearly defined downside boundary. Given the bearish moving-average interpretation and the bearish confluence readings later in the dashboard, a close below support would not simply be “noise”—it would be consistent with the existing technical bias and would represent confirmation of structural deterioration rather than a temporary wobble.
On the upside, resistance ~252.1000 is the primary validation zone for a constructive regime transition. The scenario guidance explicitly calls for a break above resistance with volume. That qualifier is critical when cross-checking other evidence: volume change is weak (Vol ROC(20) -44.29) and several participation/flow slopes (e.g., OBV slope(10) -2.106e+06, AD Line slope(10) -3.17e+06) are bearish in the signal set. In practical terms, the market would ideally show improved participation before or during any attempt to reclaim 252.1000.
The more nuanced case is a hold above support while momentum stabilizes. With RSI(14) at 28.33 (bearish/oversold region) and a slightly positive MACD histogram (0.0178), price could spend time oscillating between these zones without a decisive trend signal. In that environment, the levels operate as probabilistic decision areas rather than deterministic triggers—useful for framing risk and confirmation rather than forecasting outcomes.
Scenario view: Break above resistance with volume → continuation. Close below support → signal deterioration risk.
5) Quant Technical Dashboard (18 Signals)
KGNAI AI Technical Analysis Score (Deep Reinforcement Learning): Rank #1161 out of 1417 (Rank 1 represents the strongest technical positioning and a higher probability of favorable price behavior. As ranks increase toward the maximum, the probability of favorable outcomes weakens and bearish positioning becomes more dominant.) | Label: Bearish | Score: -0.639
18-Signal Technical Confluence Score: -0.333 (Bearish)
Overall Technical Score (18-signal confluence + DRL rank blend): -0.425 (Bearish)
Note: The blended score reflects signal strength weighted against broader AI technical ranking, which may temporarily diverge.
Blended technical score breakdown: -0.425 (Bearish | Bull 5 / Bear 11 / Neutral 2)
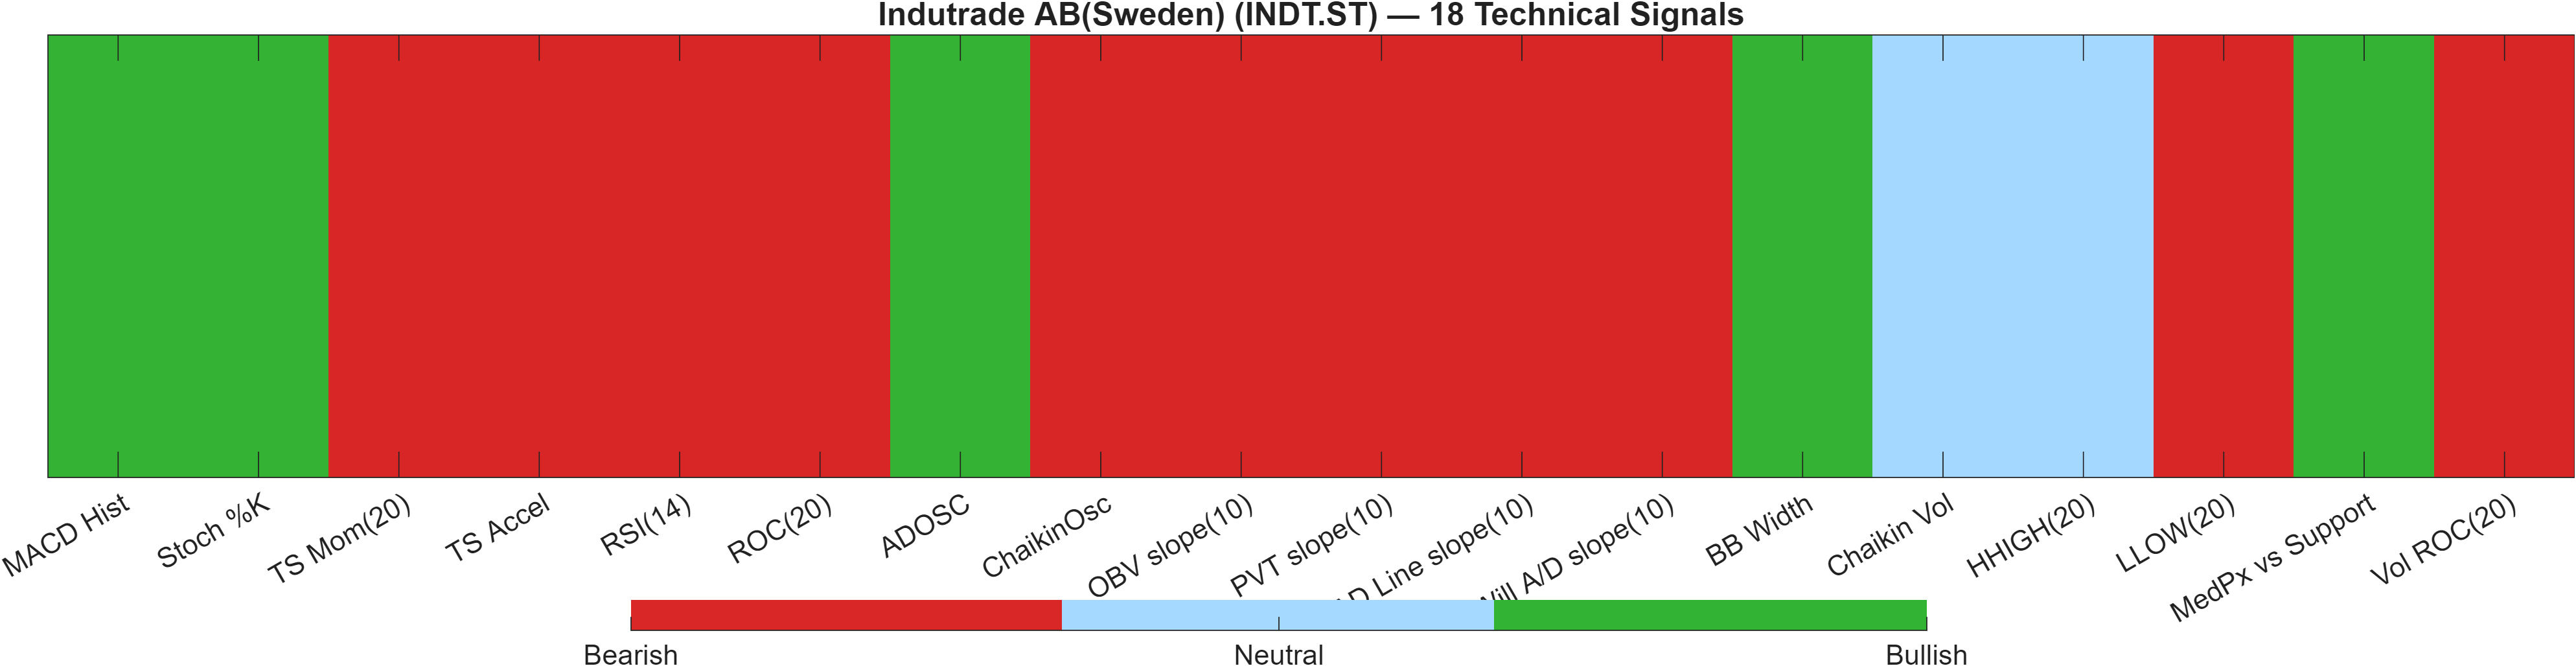
The technical layer is decisively negative despite the constructive rank backdrop. The DRL model places INDT.ST at #1161 out of 1417 with a -0.639 score, and the rule-based confluence also leans bearish with a -0.333 reading. The blended output remains bearish at -0.425, with breadth confirming the tone: 11 bearish signals versus 5 bullish and 2 neutral. This is a meaningful regime disagreement—the asset ranks well cross-sectionally, but its immediate technical behavior is not in a “leader-like” configuration.
Signal table (Bull/Bear/Neutral)
| Indicator | Value | Signal |
|---|---|---|
| MACD Hist | 0.01783 | Bullish |
| Stoch %K | 0 | Bullish |
| TS Mom(20) | -15.1 | Bearish |
| TS Accel | -0.9 | Bearish |
| RSI(14) | 28.33 | Bearish |
| ROC(20) | -7.395 | Bearish |
| ADOSC | 12.32 | Bullish |
| ChaikinOsc | -1.175e+06 | Bearish |
| OBV slope(10) | -2.106e+06 | Bearish |
| PVT slope(10) | -1.805e+04 | Bearish |
| AD Line slope(10) | -3.17e+06 | Bearish |
| Will A/D slope(10) | -26.8 | Bearish |
| BB Width | 0.08058 | Bullish |
| Chaikin Vol | -8.206 | Neutral |
| HHIGH(20) | 210.6 | Neutral |
| LLOW(20) | 189.1 | Bearish |
| MedPx vs Support | 0.2 | Bullish |
| Vol ROC(20) | -44.29 | Bearish |
Under the hood, the bullish cluster is narrow and mostly tactical (e.g., MACD hist 0.01783, ADOSC 12.32, and a supportive MedPx vs Support 0.2), while the bearish cluster is broader across momentum and participation (e.g., RSI(14) 28.33, ROC(20) -7.395, OBV slope(10) -2.106e+06). This distribution often characterizes a market attempting to stabilize before it has re-established demand confirmation. The bullish Bollinger component (BB Width 0.08058) reflects the volatility state rather than direction and should be interpreted alongside breakout/hold behavior at 192.3500 and 252.1000.
Interpretation: Indicator-level signals form the base confluence, which is then adjusted using a separate AI-driven technical ranking model. The final technical score summarizes this combined view.
6) News sentiment + extractive gist
Sentiment score (avg): 0.000 | Positive: 0% | Neutral: 100% | Negative: 0%
KGNAI AI News Sentiment Score (normalized -1 to +1): 0.98 (as of 2026-04-25) | Label: Bullish | Overall news score: 0.99
Positive Developments
Recent coverage across major financial outlets indicates a constructive undercurrent around how Indutrade AB (INDT.ST) is being framed following a period of share price softness. The dominant “positive” angle is not driven by discrete event catalysts in the provided feed, but rather by renewed attention to valuation context and the possibility that recent weakness is drawing incremental analytical interest. In a market-structure sense, this type of coverage can matter most when it coincides with technical stabilization signals: the MACD histogram (0.0178) is slightly positive even while the broader dashboard remains bearish, and the stock is operating with well-defined reference points at 192.3500 (support) and 252.1000 (resistance). The headline sentiment split in the dataset is neutral (0% positive / 100% neutral), but the model’s normalized sentiment score is elevated (0.98 as of 2026-04-25), which can be read as a bias toward constructive framing rather than explicit bullish headlines.
Neutral / Mixed Developments
The news flow in the provided data is primarily informational and repetitive in theme, emphasizing interpretation of recent price behavior rather than introducing new operational developments. That aligns with the measured sentiment distribution—avg 0.000 with 100% neutral classification—suggesting the narrative tone is more analytical than directional. This neutrality is consistent with the broader signal mix: longer-horizon ranks remain strong (including the Yearly #6), while technical confluence is bearish (-0.425 overall score), creating a legitimate “wait for confirmation” environment. When coverage is neutral and technicals are still repairing, market attention tends to concentrate on level interaction, volatility regime (bandwidth 0.0806), and whether participation improves ahead of a resistance test.
Negative / Risk Signals
The main risk signaled by the news context is the lack of a clear, fresh catalyst in the provided dataset—discussion centers on softness and valuation framing rather than definitive fundamental inflections. In parallel, the technical evidence carries identifiable downside risk markers: moving-average interpretation is bearish, the DRL technical rank is weak (#1161), and multiple participation/flow measures are negative (e.g., Vol ROC(20) -44.29). In this setting, “negative” is less about adverse headlines and more about the possibility that price remains trapped in a corrective regime, where any attempt to rally can fail without volume confirmation. The explicit invalidation condition remains mechanical: a close below 192.3500 would align with the bearish confluence and would likely shift attention away from mean reversion and toward continued deterioration risk within the current structure.
- Whether price continues to respect 192.3500 as support while momentum stabilizes (RSI 28.33 vs MACD hist 0.0178).
- Any evidence of participation recovery given Vol ROC(20) -44.29, especially on approaches toward 252.1000.
- Shifts in the blended technical read (-0.425) versus the persistent longer-horizon rank strength (Yearly #6).
Snapshot: AI Rank (Short–Mid–Long): Bullish (Bullish–Bullish–Bullish) · Technical Confluence: Bearish · Key Levels: Support ~192.35 | Resistance ~252.10 · News Sentiment: Neutral
Sources referenced: Reuters, Bloomberg, Yahoo Finance, MarketWatch, Investing.com
7) Sources
- Indutrade (OM:INDT): Examining Valuation Following Recent Share Price Softness — https://finance.yahoo.com/news/indutrade-om-indt-examining-valuation-111039061.html?.tsrc=rss
You may also like: How KGNAI AI ranks instruments across global markets
Disclaimer: KGNAI provides AI-generated analytics and educational market commentary only. This is not financial advice. Markets involve risk. Always do your own research.