
REL.LSE (RELX PLC) — Multi-horizon ranks vs bearish technical confluence (15-May-2026)
REL.LSE (RELX PLC) is presented here through a balance-of-evidence framework that emphasizes cross-confirmation across ranks, trend structure, momentum, volatility regime, and systematically processed news sentiment. As of 15-May-2026, KGNAI’s cross-sectional positioning shows a split profile: the Daily rank (#140/1417) sits in the upper decile while the Yearly rank (#149/1417) remains similarly strong, yet intermediate horizons (Weekly #660; Monthly #388; 3-Monthly #683; 6-Monthly #406) skew neutral. Technically, the dashboard is more cautious: the 18-signal confluence score (-0.556) and overall technical score (-0.521) are bearish, supported by weak momentum readings (e.g., RSI(14) 9.438, MACD histogram -30.7891). Key decision zones are defined at support ~2369.0000 and resistance ~2743.0000, with Bollinger bandwidth at 0.1784 indicating a relatively contained volatility regime.
- Short / Mid / Long rank stance: Neutral / Neutral / Neutral (with strong outliers on Daily #140 and Yearly #149 within a 1417-instrument universe).
- Technical confluence label: Bearish (18-signal confluence -0.556; overall technical score -0.521).
- Key levels: Support ~2369.0000 | Resistance ~2743.0000.
- News sentiment bias: Neutral on distribution (Positive 0% / Neutral 100% / Negative 0%) alongside a normalized news score of 1.00 (Bullish label; overall news score 0.96).
- Confirmation / invalidation condition: A break above 2743.0000 with volume would support continuation; a close below 2369.0000 increases deterioration risk.
What KGNAI Measures
KGNAI evaluates assets using large cross-sectional datasets built from millions of structured data points. Inputs incorporate fundamental metrics, technical structures, and systematically processed news sentiment. Statistical models, machine learning, and AI frameworks are used to assess relative positioning, signal alignment, and probabilistic behavior across broad universes.
How to Read This Report
- Ranks are comparative across the tracked universe, not absolute price targets.
- Confluence reflects alignment among independent signal groups.
- Support/resistance levels are probabilistic decision zones, not guarantees.
- Sentiment provides contextual bias within the broader analytical framework.
1) KGNAI AI Analysis
Region: EUROPE
Total universe size: 1417 ranked instruments
- Daily rank: #140 out of 1417 — Bullish
- Weekly rank: #660 out of 1417 — Neutral
- Monthly rank: #388 out of 1417 — Neutral
- 3-Monthly rank: #683 out of 1417 — Neutral
- 6-Monthly rank: #406 out of 1417 — Neutral
- Yearly rank: #149 out of 1417 — Bullish
The rank stack shows time-horizon dispersion rather than a single-direction consensus. REL.LSE screens strongly in the upper decile on the Daily horizon (#140/1417) and retains a similar profile on the Yearly horizon (#149/1417). In contrast, the intermediate horizons cluster in neutral territory (Weekly #660 and 3-Monthly #683 both sit in the lower half of the universe, while Monthly #388 and 6-Monthly #406 sit closer to the middle).
This pattern is often consistent with a market that has either (a) experienced a shorter-term re-rating within a broader long-run constructive regime, or (b) produced a transient short-term impulse that has not yet propagated through the mid-horizon filters. KGNAI’s term view is explicitly Neutral across Short-term, Mid-term, and Long-term, implying that the model is not treating the strong Daily/Yearly ranks as a sufficient basis for a uniform stance without corroboration from other signal groups.
The most useful read-through is alignment risk: when daily and yearly measures agree but the weekly-to-6M band remains neutral, follow-through typically depends on whether trend structure and momentum stop contradicting each other (covered in Sections 2–5). Until that occurs, the ranks are better interpreted as relative positioning inside the European universe rather than a standalone directional message.
KGNAI ranks each instrument across large universes using multiple proprietary AI tests and statistical models (millions of data points). Lower ranks generally indicate stronger probability of favorable performance behavior, while higher ranks indicate weaker probability and more bearish positioning.
Term view: Short-term: Neutral. Mid-term: Neutral. Long-term: Neutral.
Want the full universe and complete rank tables? Unlock full access on KGNAI: https://www.kgnai.com/pricing
2) Price & trend overview
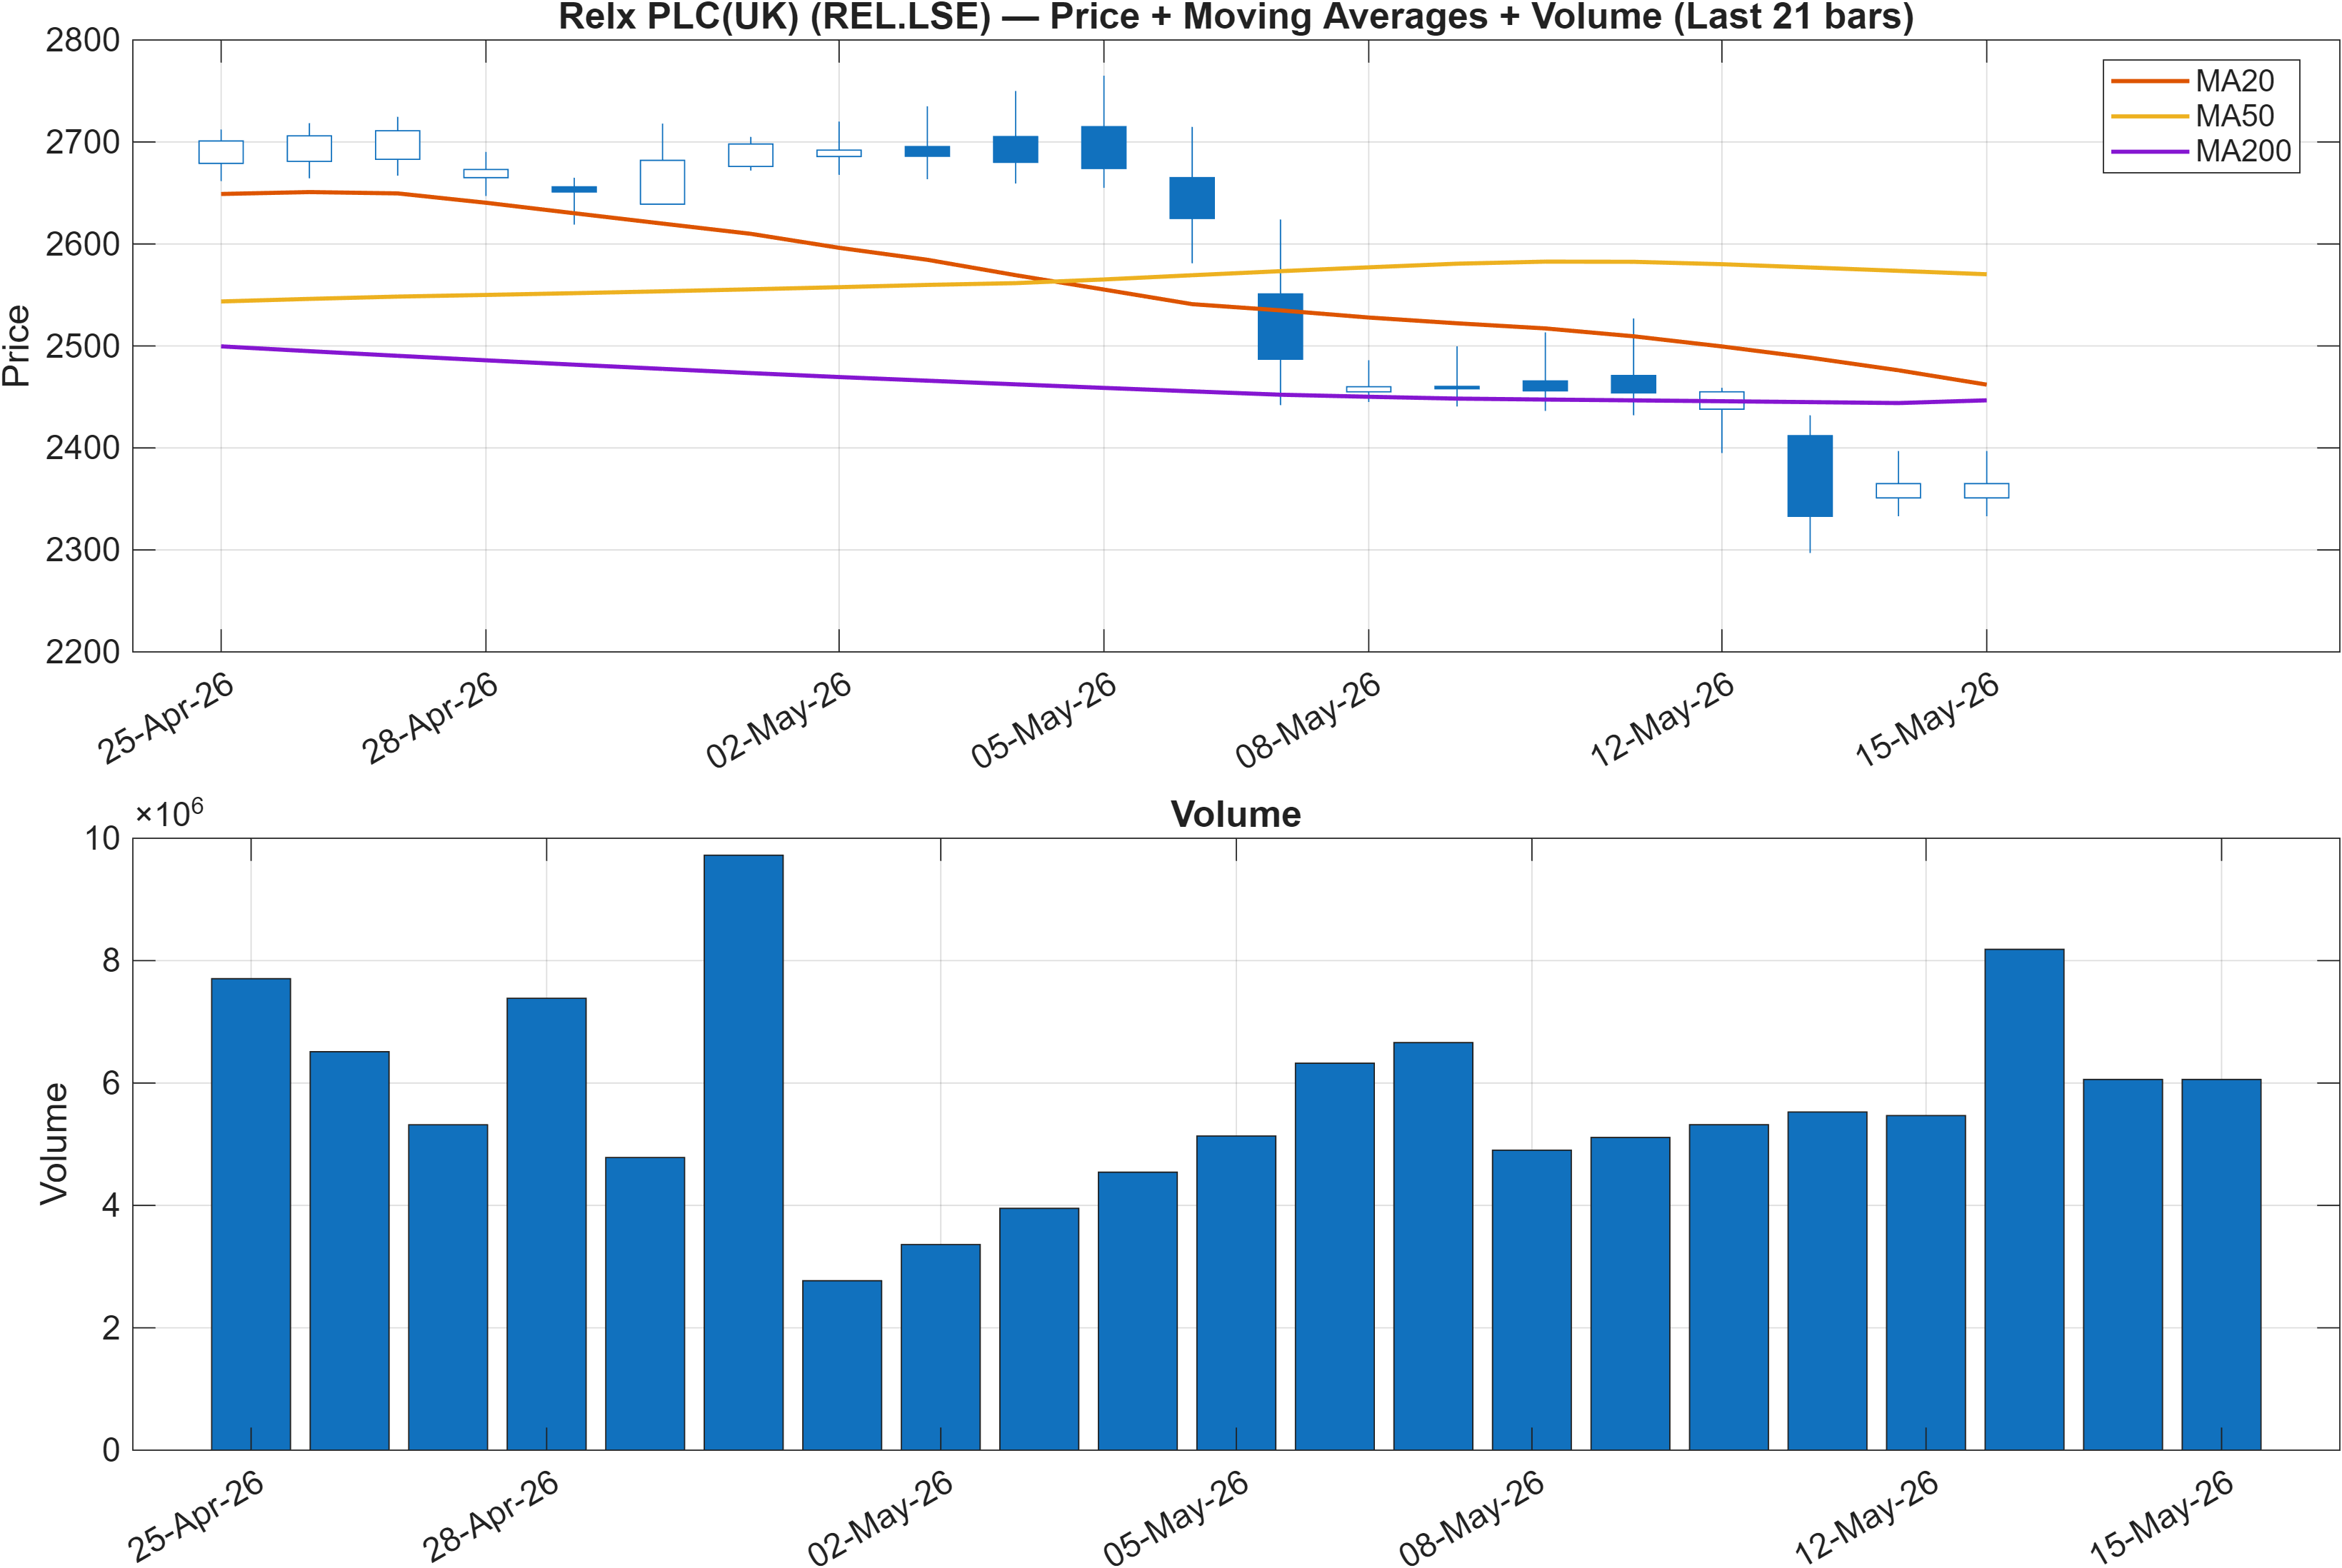
Trend interpretation is currently split across time constants. The close is below the MA50 (bearish) while MA50 remains above MA200 (bullish). This combination typically describes a market where the longer trend has not fully broken, but the nearer-term tape is soft enough to keep tactical pressure on rebounds.
Alignment vs divergence across horizons
This moving-average configuration helps contextualize why REL.LSE can simultaneously post a strong Daily rank (#140) and Yearly rank (#149) while the mid-horizon ranks stay neutral (e.g., Weekly #660 and 3-Monthly #683). The long-run signal (MA50>MA200) is consistent with the constructive yearly placement, while the short-run weakness (close<MA50) is consistent with a neutral-to-cautious intermediate posture.
Where trend structure meets decision zones
With key levels defined at 2369.0000 (support) and 2743.0000 (resistance), trend validation becomes less about subjective interpretation and more about location. Trading beneath the faster average increases the importance of the support shelf: acceptance below 2369.0000 would shift the balance toward trend deterioration risk, whereas a recovery that carries through 2743.0000 (particularly with volume) would better reconcile the long-term MA structure with a renewed short-term impulse.
Volume is best treated here as the arbiter between a routine pullback within a longer structure and a transition into a more persistent downtrend. Not available in the provided data for explicit volume statistics; the figure provides the visual context only.
3) Momentum & volatility dashboard
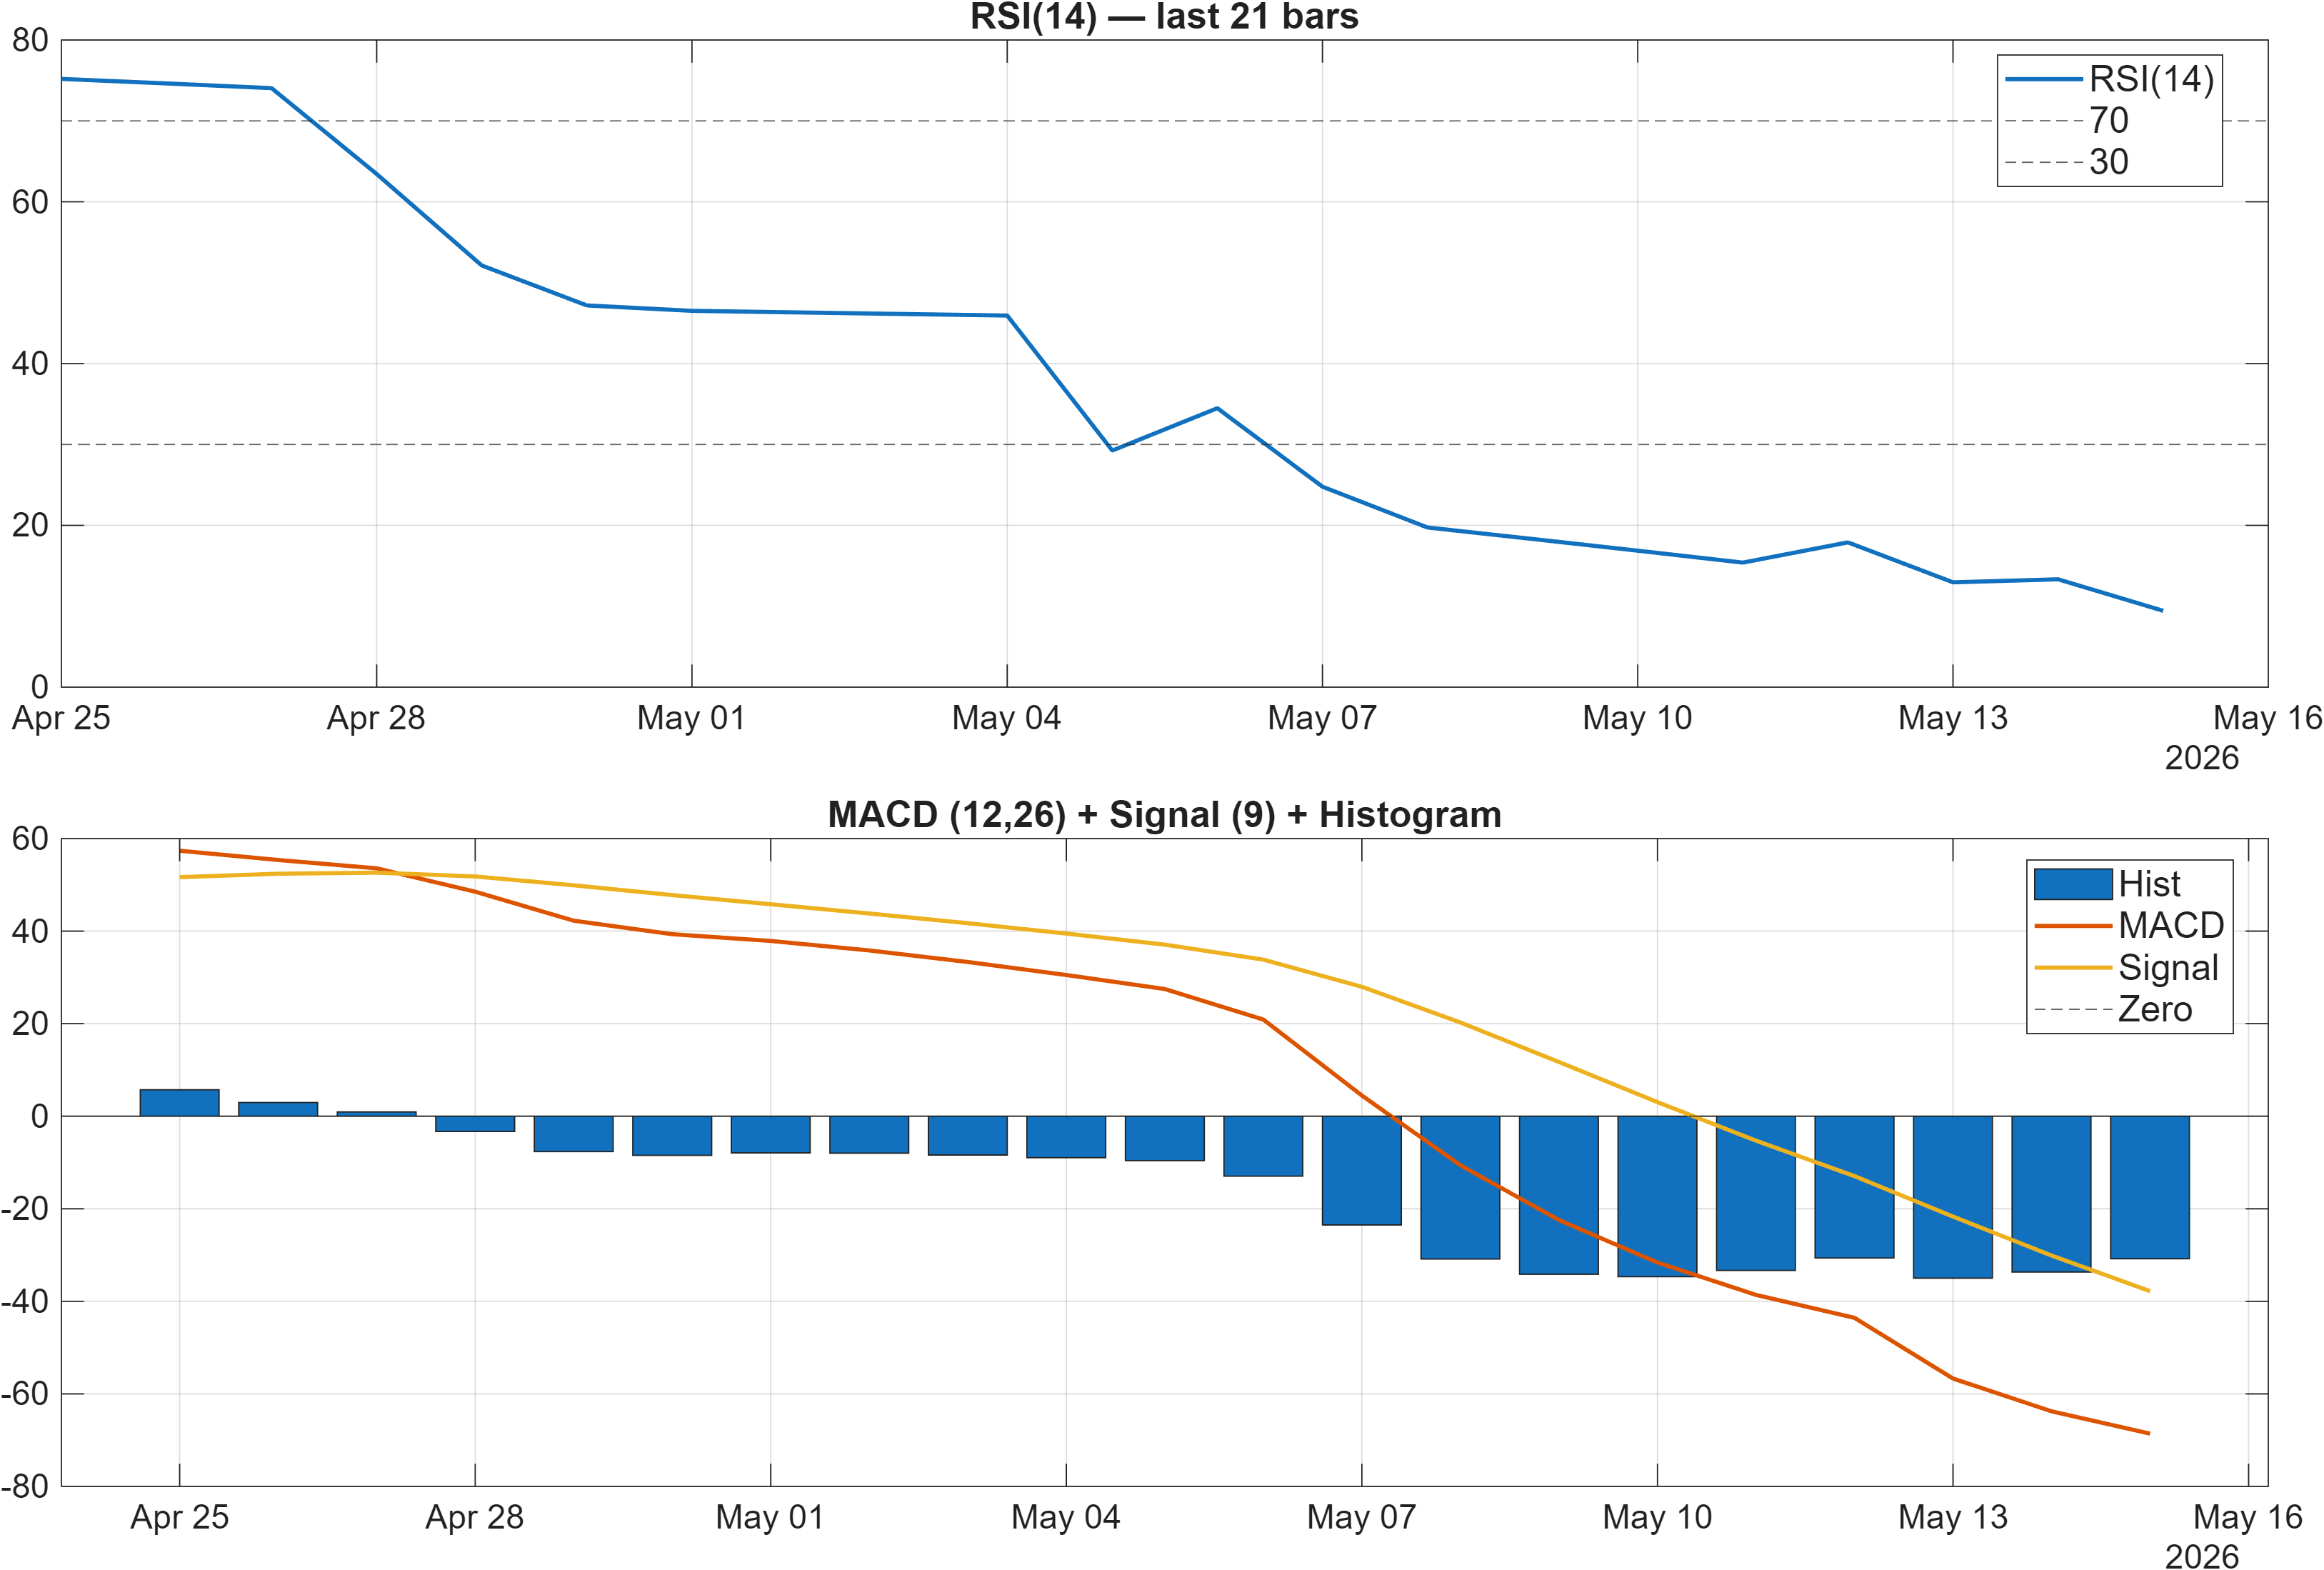
Momentum is the main counterweight to the stronger daily/yearly rank impression. RSI bias is bearish with RSI(14) 9.438, and the MACD histogram is negative at -30.7891. In combination, that pairing typically signals that downside momentum has been dominant, even if the longer-term structure has not fully capitulated.
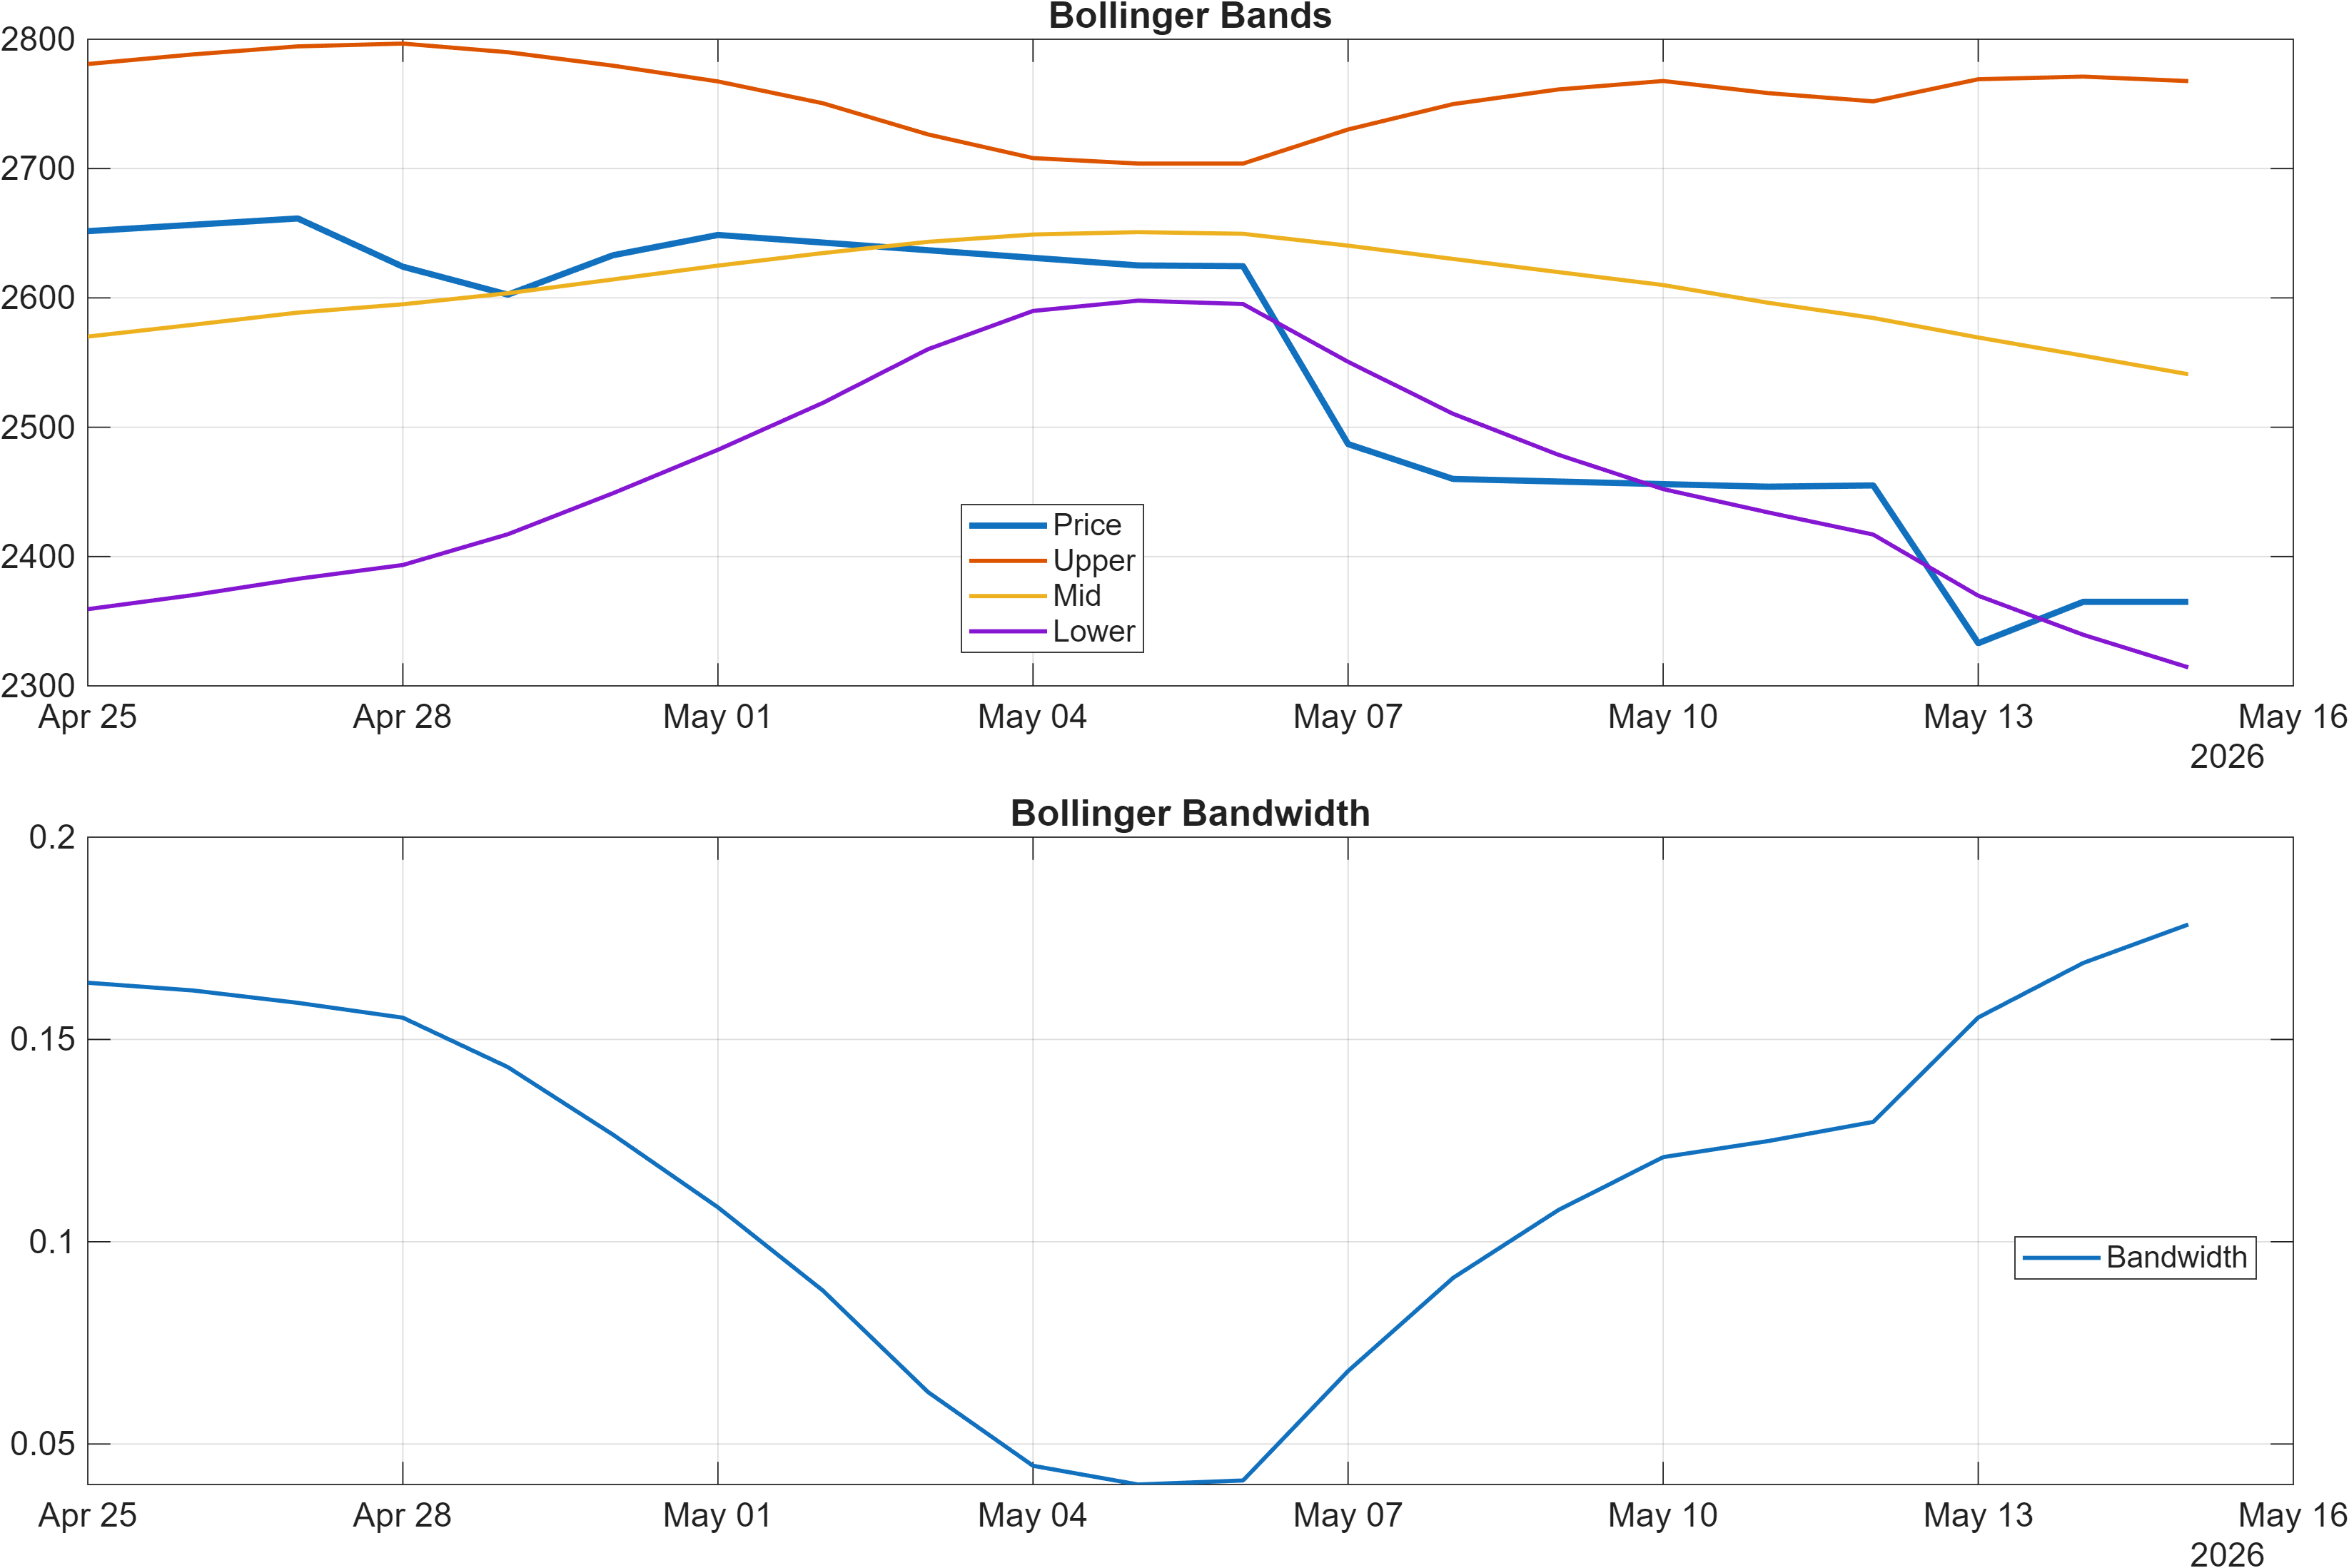
Volatility regime is comparatively contained with Bollinger bandwidth 0.1784. That matters because very weak momentum readings can arise in both expanding-volatility selloffs and more controlled, grinding drawdowns; bandwidth helps discriminate between those regimes. Here, the bandwidth suggests that while momentum is weak, the market is not simultaneously exhibiting the highest-volatility stress state.
Trend persistence vs exhaustion
With RSI deeply depressed and MACD histogram materially negative, the dashboard is consistent with a market that has been persistently pressured. However, the relatively moderate bandwidth can also be consistent with compression following a directional move, where marginal sellers become less aggressive. Whether that becomes a base or simply a pause is not determined by these indicators alone; it is more reliably assessed by how price behaves around the nearby decision zones (2369.0000 and 2743.0000) and whether breadth/volume proxies improve (Section 5).
Cross-check with rank dispersion
The neutrality of the Weekly (#660) and 3-Monthly (#683) ranks aligns with the idea that negative momentum has had time to influence mid-horizon measures. For the Daily and Yearly ranks to remain strong in this context, the cross-sectional model is likely picking up relative stability versus peers or a longer-term resilience factor. The immediate analytical priority is whether momentum begins to rotate without requiring a volatility spike.
4) Support / Resistance zones
Support ~ 2369.0000 | Resistance ~ 2743.0000
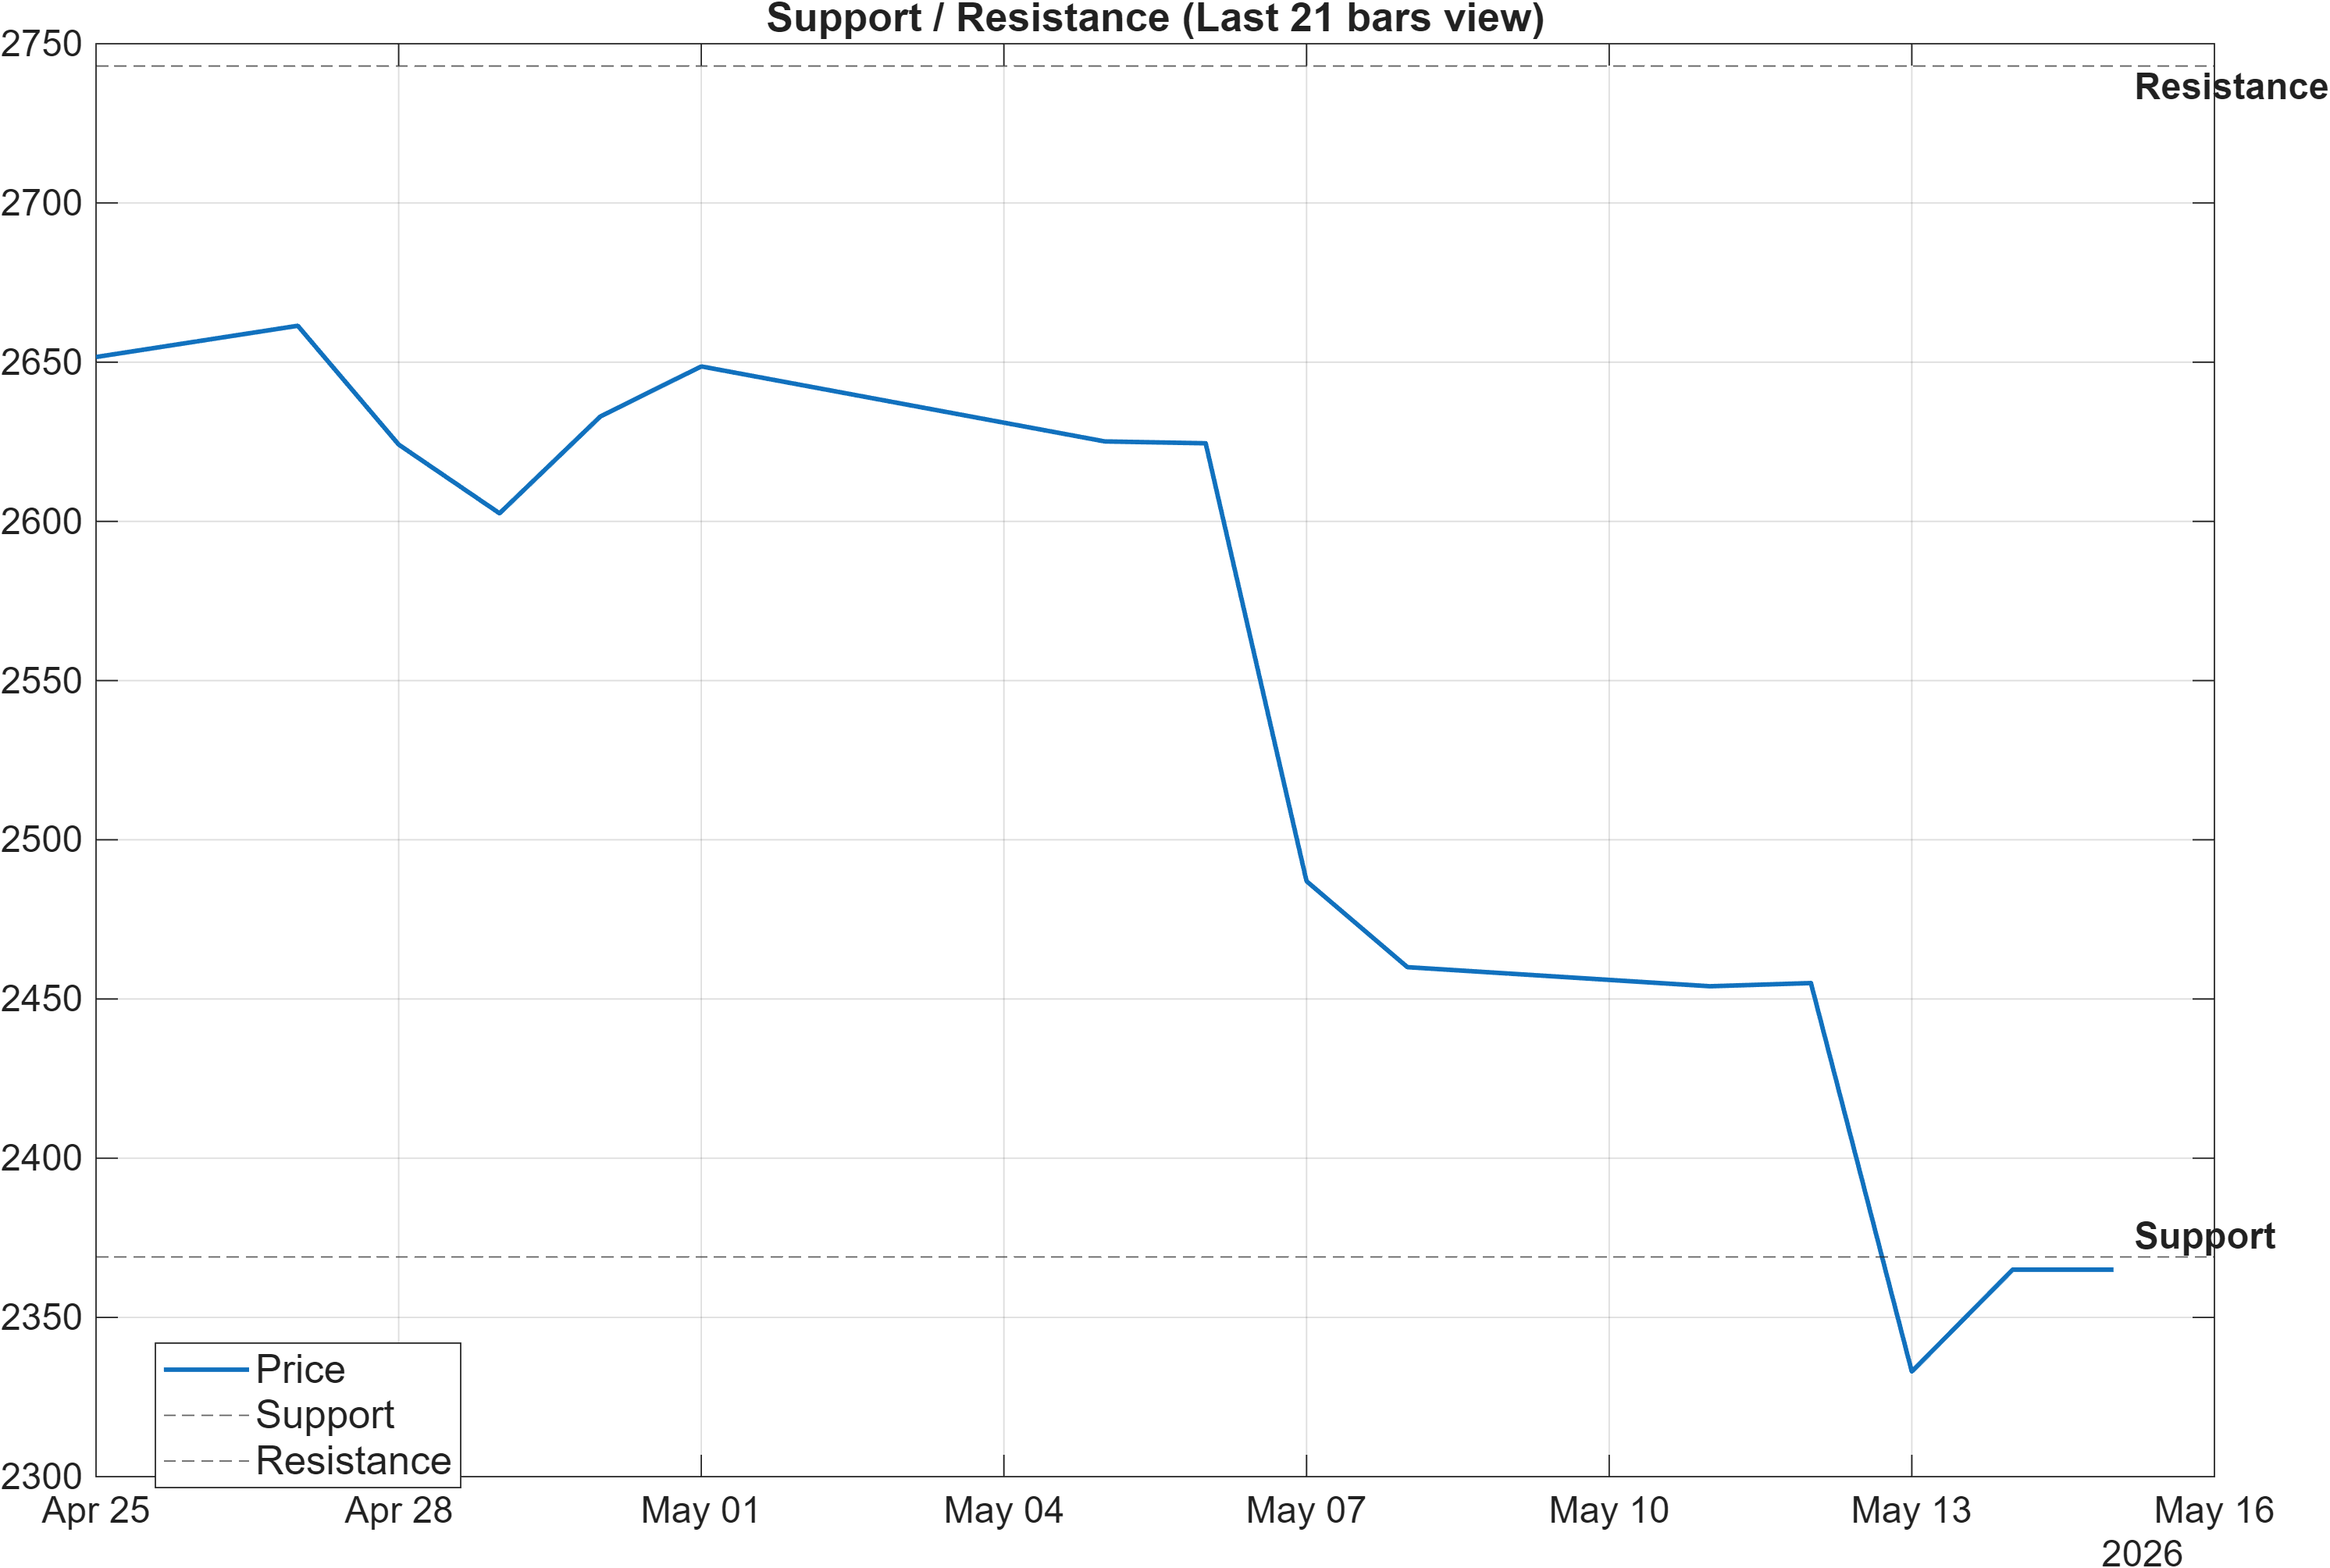
The level map is tight enough to be actionable and broad enough to matter for multiple horizons. With momentum gauges bearish (RSI(14) 9.438; MACD histogram -30.7891) and the close below MA50 (Section 2), support at 2369.0000 becomes the first integrity check for whether weakness remains contained within a longer structure.
Regime continuation vs transition
A market that holds above support while volatility remains contained (bandwidth 0.1784) can transition from persistent weakness into a stabilization phase without needing an abrupt reversal. Conversely, a close below 2369.0000 would represent a structural degradation signal in KGNAI’s scenario framing, particularly because it would occur alongside already-weak momentum conditions—raising the probability that mid-horizon neutrality tilts lower.
Resistance as a confluence test, not a target
The 2743.0000 resistance zone functions as a confluence checkpoint for the “split” technical state: a break above resistance with volume would better align the bullish long-term moving-average relationship (MA50>MA200) with a short-term recovery in trend position (close back above MA50). Until that occurs, rebounds that stall below resistance remain consistent with the current bearish technical scoring (Section 5), even if cross-sectional ranks look comparatively favorable.
Scenario view: Break above resistance with volume → continuation. Close below support → signal deterioration risk.
5) Quant Technical Dashboard (18 Signals)
KGNAI AI Technical Analysis Score (Deep Reinforcement Learning): Rank #1020 out of 1417 (Rank 1 represents the strongest technical positioning and a higher probability of favorable price behavior. As ranks increase toward the maximum, the probability of favorable outcomes weakens and bearish positioning becomes more dominant.) | Label: Neutral | Score: -0.440
18-Signal Technical Confluence Score: -0.556 (Bearish)
Overall Technical Score (18-signal confluence + DRL rank blend): -0.521 (Bearish)
Note: The blended score reflects signal strength weighted against broader AI technical ranking, which may temporarily diverge.
Blended technical score breakdown: -0.521 (Bearish | Bull 2 / Bear 12 / Neutral 4)
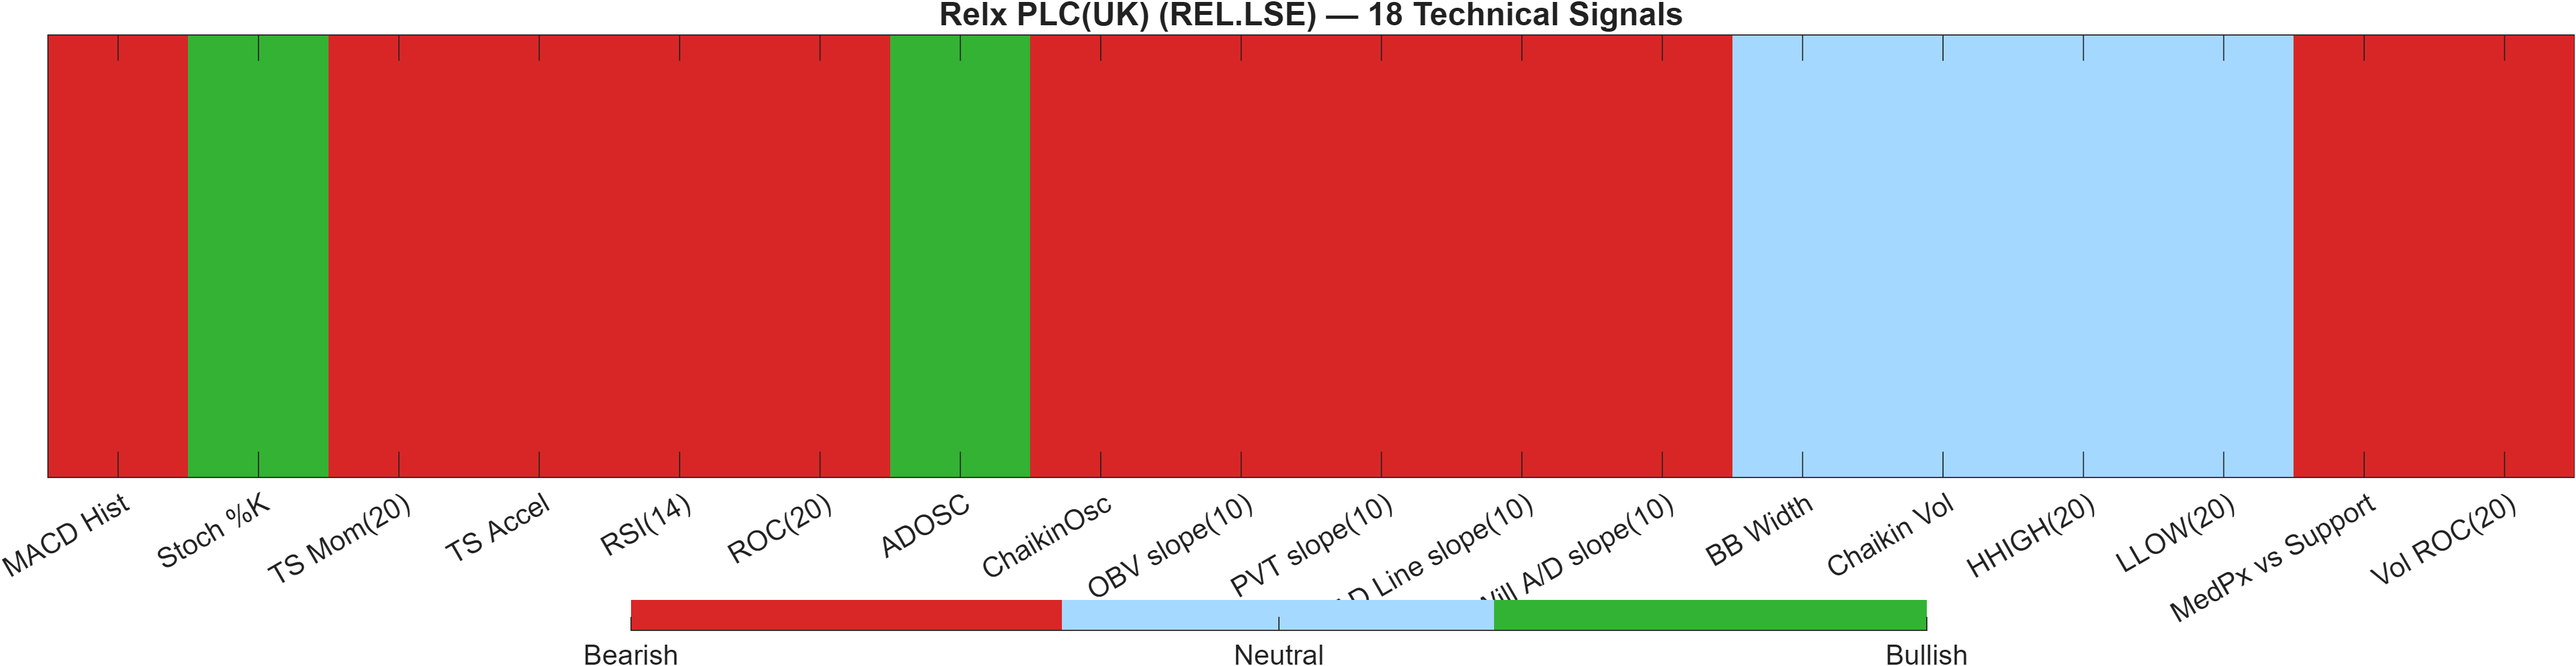
The dashboard is unambiguously tilted toward bearishness at the signal-aggregation level. The 18-signal confluence score (-0.556) and overall technical score (-0.521) both carry a bearish label, and the internal mix (Bull 2 / Bear 12 / Neutral 4) indicates that weakness is broad rather than isolated to one indicator family.
Signal table (Bull/Bear/Neutral)
| Indicator | Value | Signal |
|---|---|---|
| MACD Hist | -30.79 | Bearish |
| Stoch %K | 16.28 | Bullish |
| TS Mom(20) | -341 | Bearish |
| TS Accel | -528 | Bearish |
| RSI(14) | 9.438 | Bearish |
| ROC(20) | -10.97 | Bearish |
| ADOSC | 60.94 | Bullish |
| ChaikinOsc | -3.338e+06 | Bearish |
| OBV slope(10) | -3.05e+07 | Bearish |
| PVT slope(10) | -8.537e+05 | Bearish |
| AD Line slope(10) | -1.355e+07 | Bearish |
| Will A/D slope(10) | -456.7 | Bearish |
| BB Width | 0.1784 | Neutral |
| Chaikin Vol | -1.259 | Neutral |
| HHIGH(20) | 2765 | Neutral |
| LLOW(20) | 2297 | Neutral |
| MedPx vs Support | -4 | Bearish |
| Vol ROC(20) | -6.955 | Bearish |
Compression of “bearish breadth” vs isolated strength
Even where the dashboard surfaces bullish pockets (e.g., Stoch %K 16.28 and ADOSC 60.94), the broader set remains skewed by negative momentum and negative volume-flow slopes. The bearish RSI (9.438) and negative MACD histogram (-30.79 in the signal table; -30.7891 in the interpretation line) reinforce that the dominant impulse has been down.
DRL rank divergence as a secondary filter
The Deep Reinforcement Learning technical rank sits at #1020/1417 with a Neutral label (score -0.440), which is meaningfully weaker than the strong Daily/Yearly cross-sectional ranks from Section 1. This divergence suggests that while REL.LSE may compare favorably to peers on some horizons, the pure technical state captured by the 18-signal stack remains challenged. Practically, this makes the 2369.0000–2743.0000 range more significant: the dashboard is positioned such that level breaks can quickly resolve (or deepen) the current disagreement between relative ranks and technical breadth.
Interpretation: Indicator-level signals form the base confluence, which is then adjusted using a separate AI-driven technical ranking model. The final technical score summarizes this combined view.
6) News sentiment + extractive gist
Note: Some headlines were matched using a looser (title-only) rule to avoid missing relevant coverage.
Sentiment score (avg): 0.000 | Positive: 0% | Neutral: 100% | Negative: 0%
KGNAI AI News Sentiment Score (normalized -1 to +1): 1.00 (as of 2026-04-24) | Label: Bullish | Overall news score: 0.96
Positive Developments
Recent coverage across major financial outlets reads as broadly constructive in tone, with the model registering a normalized sentiment score of 1.00 (Bullish label) and an overall news score of 0.96. At the same time, the distributional breakdown shows Neutral: 100% with Positive: 0% and Negative: 0%, implying that the “bullish” signal is driven more by the model’s normalization and weighting than by an overtly positive headline mix. From an analytics standpoint, this creates a supportive context rather than a catalyst: sentiment is not presenting as a clear headwind, which can matter when technicals are already pressured (overall technical score -0.521). The practical value is in watching whether sentiment stays firm while price approaches the defined technical decision zones (2369.0000 support and 2743.0000 resistance), since stable sentiment alongside weakening momentum (RSI(14) 9.438) can sometimes coincide with reduced incremental selling pressure.
Neutral / Mixed Developments
The sentiment summary itself is mixed: the average sentiment score is 0.000 and the classification is entirely neutral by share, yet KGNAI’s normalized score remains elevated. This is consistent with a news tape that is more informational than directional, where coverage may be relevant but not clearly value-judgmented by the classifier. For REL.LSE, that neutrality can be analytically useful: it reduces the probability that near-term price action is being dominated by a one-sided narrative, shifting attention back to technical state and market structure. With Bollinger bandwidth at 0.1784, a relatively contained volatility regime, a neutral news environment can reinforce range-bound behavior until a level break occurs. In this context, sentiment is best treated as a background condition rather than a primary driver.
Negative / Risk Signals
The clearest risk signal from the news block is not negative coverage (which screens at 0%), but potential signal-to-asset mismatch and dilution: items captured by looser matching can reduce interpretability, particularly when the dataset includes generalized or cross-company topics. That raises the bar for using the bullish-labeled normalized score (1.00) as a decisive input. Against a bearish technical backdrop—RSI(14) 9.438, MACD histogram -30.7891, and a confluence score of -0.556—a “clean” negative tape would have been confirming; instead, the tape is neutral. The risk, therefore, is that traders over-attribute meaning to the sentiment label while price remains below key structure (close below MA50) and near a critical support zone (2369.0000) where technical deterioration is explicitly flagged on a close below support.
- Whether sentiment remains stable while price tests 2369.0000 support.
- Any shift in the neutral distribution (currently 100%) that aligns with a technical inflection (RSI/MACD).
- Follow-through in price behavior if 2743.0000 is reclaimed with volume.
Snapshot: AI Rank (Short–Mid–Long): Neutral (Neutral–Neutral–Neutral) · Technical Confluence: Bearish · Key Levels: Support ~2369.00 | Resistance ~2743.00 · News Sentiment: Neutral
7) Sources
- Forza Horizon 6 Release Date, Early Access And Game Pass Details - Forbes — https://news.google.com/rss/articles/CBMiuAFBVV95cUxQRng2WXJkUGpuT2R6UjdwVExVSHVidGhfZGExc1BuMmxrVUlfNEJ3OEJReGJPX0ZrMV9WYU8wYjJSaEpPTnFyeW42VXNJcWJ1aUNrSzAzLVc1elJ0dE1RSTM4X2ZobFBQUjlnbVFmekg2STU2a0dJTVZLYUpzaDhmNlhLeWZjSldZZUlpTEhiNVVkaVZaQWM5dFFsQTNzb29RUmI5ZUlhRkJ3eTU3M3gzQjRSUThrcXNh?oc=5
- Swisscom stock (CH0008742519): Earnings released May 7 with YTD gain of 19% - AD HOC NEWS — https://news.google.com/rss/articles/CBMiygFBVV95cUxOS3VQNTRkR1Mwb25QVlVIdUpiaTZJcEowNFJ6b0Rtd29SbWpWZGNjODBGWC1NbHQ2MDBsUzJVbldQRWtNSHpfZFdtVVhCYkRBb0gwWWhINWVHN05FZEJFM2JITTNKMlBNMW54dXROUDRrTXpvdDA3R2FKV3ZTeXhnczBlX293SlBDUXhia2pjODZ1TXlnS19qdUVDN2pwbUE0bmkwNGtRc2x0UzlSa3dGM1pIR1MyU0QwUTNTNmt1WHpidVlhUjJvUU5n?oc=5
You may also like: How KGNAI AI ranks instruments across global markets
Disclaimer: KGNAI provides AI-generated analytics and educational market commentary only. This is not financial advice. Markets involve risk. Always do your own research.