
Icelandic Salmon As(Norway) (ISLAX.OL) — Neutral short-term, bearish technical confluence (27-May-2026)
Icelandic Salmon As(Norway) (ISLAX.OL) sits in a mixed regime as of 27-May-2026: cross-sectional KGNAI ranks are Neutral on the daily horizon (#748/1414) and Neutral on the weekly horizon (#1041/1414), while the monthly horizon shifts to Bearish (#1386/1414). Technically, the composite picture leans defensive, with an overall blended technical score of -0.445 (Bearish) and a reinforcement-learning technical rank of #1205/1414. Momentum gauges reinforce the cautious tone, including RSI(14) at 25 and MACD histogram at -0.5553, while volatility is not extreme with Bollinger bandwidth at 0.1420. Key decision zones remain well-defined: support ~68.7083 and resistance ~86.0000. Notably, news sentiment is strongly positive (normalized score 1.00), setting up a potential sentiment-versus-price tension that requires confirmation via price/volume behavior around the stated levels.
- Rank stance: Short-term Neutral (Daily #748/1414); Mid-term Bearish (Monthly #1386/1414); Long-term Not available
- Technical confluence: Bearish (Overall blended technical score -0.445; DRL rank #1205/1414)
- Key levels: Support ~68.7083 | Resistance ~86.0000
- News sentiment bias: Bullish (normalized 1.00; avg sentiment 0.209)
- Confirmation / invalidation: A sustained move above 86.0000 with volume supports continuation; a close below 68.7083 elevates deterioration risk.
KGNAI evaluates assets using large cross-sectional datasets built from millions of structured data points. Inputs incorporate fundamental metrics, technical structures, and systematically processed news sentiment. Statistical models, machine learning, and AI frameworks are used to assess relative positioning, signal alignment, and probabilistic behavior across broad universes.
- Ranks are comparative across the tracked universe, not absolute price targets.
- Confluence reflects alignment among independent signal groups.
- Support/resistance levels are probabilistic decision zones, not guarantees.
- Sentiment provides contextual bias within the broader analytical framework.
1) KGNAI AI Analysis
Region: EUROPE
Total universe size: 1414 ranked instruments
- Daily rank: #748 out of 1414 — Neutral
- Weekly rank: #1041 out of 1414 — Neutral
- Monthly rank: #1386 out of 1414 — Bearish
- 3-Monthly rank: Not available for this horizon — Not available
- 6-Monthly rank: Not available for this horizon — Not available
- Yearly rank: Not available for this horizon — Not available
The rank stack points to a regime shift from neutral to weaker mid-term positioning. A daily rank of #748/1414 sits near the middle of the tracked universe, consistent with near-term indecision rather than a clean edge. The weekly reading at #1041/1414 leans into the lower half, suggesting that recent relative behavior has been less constructive versus peers, even if not yet in outright capitulation territory on that horizon.
The monthly rank is the key differentiator: #1386/1414 places ISLAX.OL in the extreme weak tail of the universe for that window. In cross-sectional terms, this kind of placement often coincides with either persistent downtrends, extended underperformance versus the regional cohort, or a lack of stabilizing signals that would typically push an instrument out of the bottom bucket.
Longer-horizon ranks (3-monthly, 6-monthly, yearly) are Not available in the provided data. That absence matters: it limits the ability to verify whether the monthly weakness is a temporary air-pocket or part of a broader long-cycle drawdown. Practically, the current configuration argues for treating any short-term stabilization as tactically tradable but structurally unconfirmed until the mid-term rank improves or price reclaims key technical thresholds discussed below.
KGNAI ranks each instrument across large universes using multiple proprietary AI tests and statistical models (millions of data points). Lower ranks generally indicate stronger probability of favorable performance behavior, while higher ranks indicate weaker probability and more bearish positioning.
Term view: Short-term: Neutral. Mid-term: Bearish. Long-term: Not available.
Want the full universe and complete rank tables? Unlock full access on KGNAI: https://www.kgnai.com/pricing
2) Price & trend overview
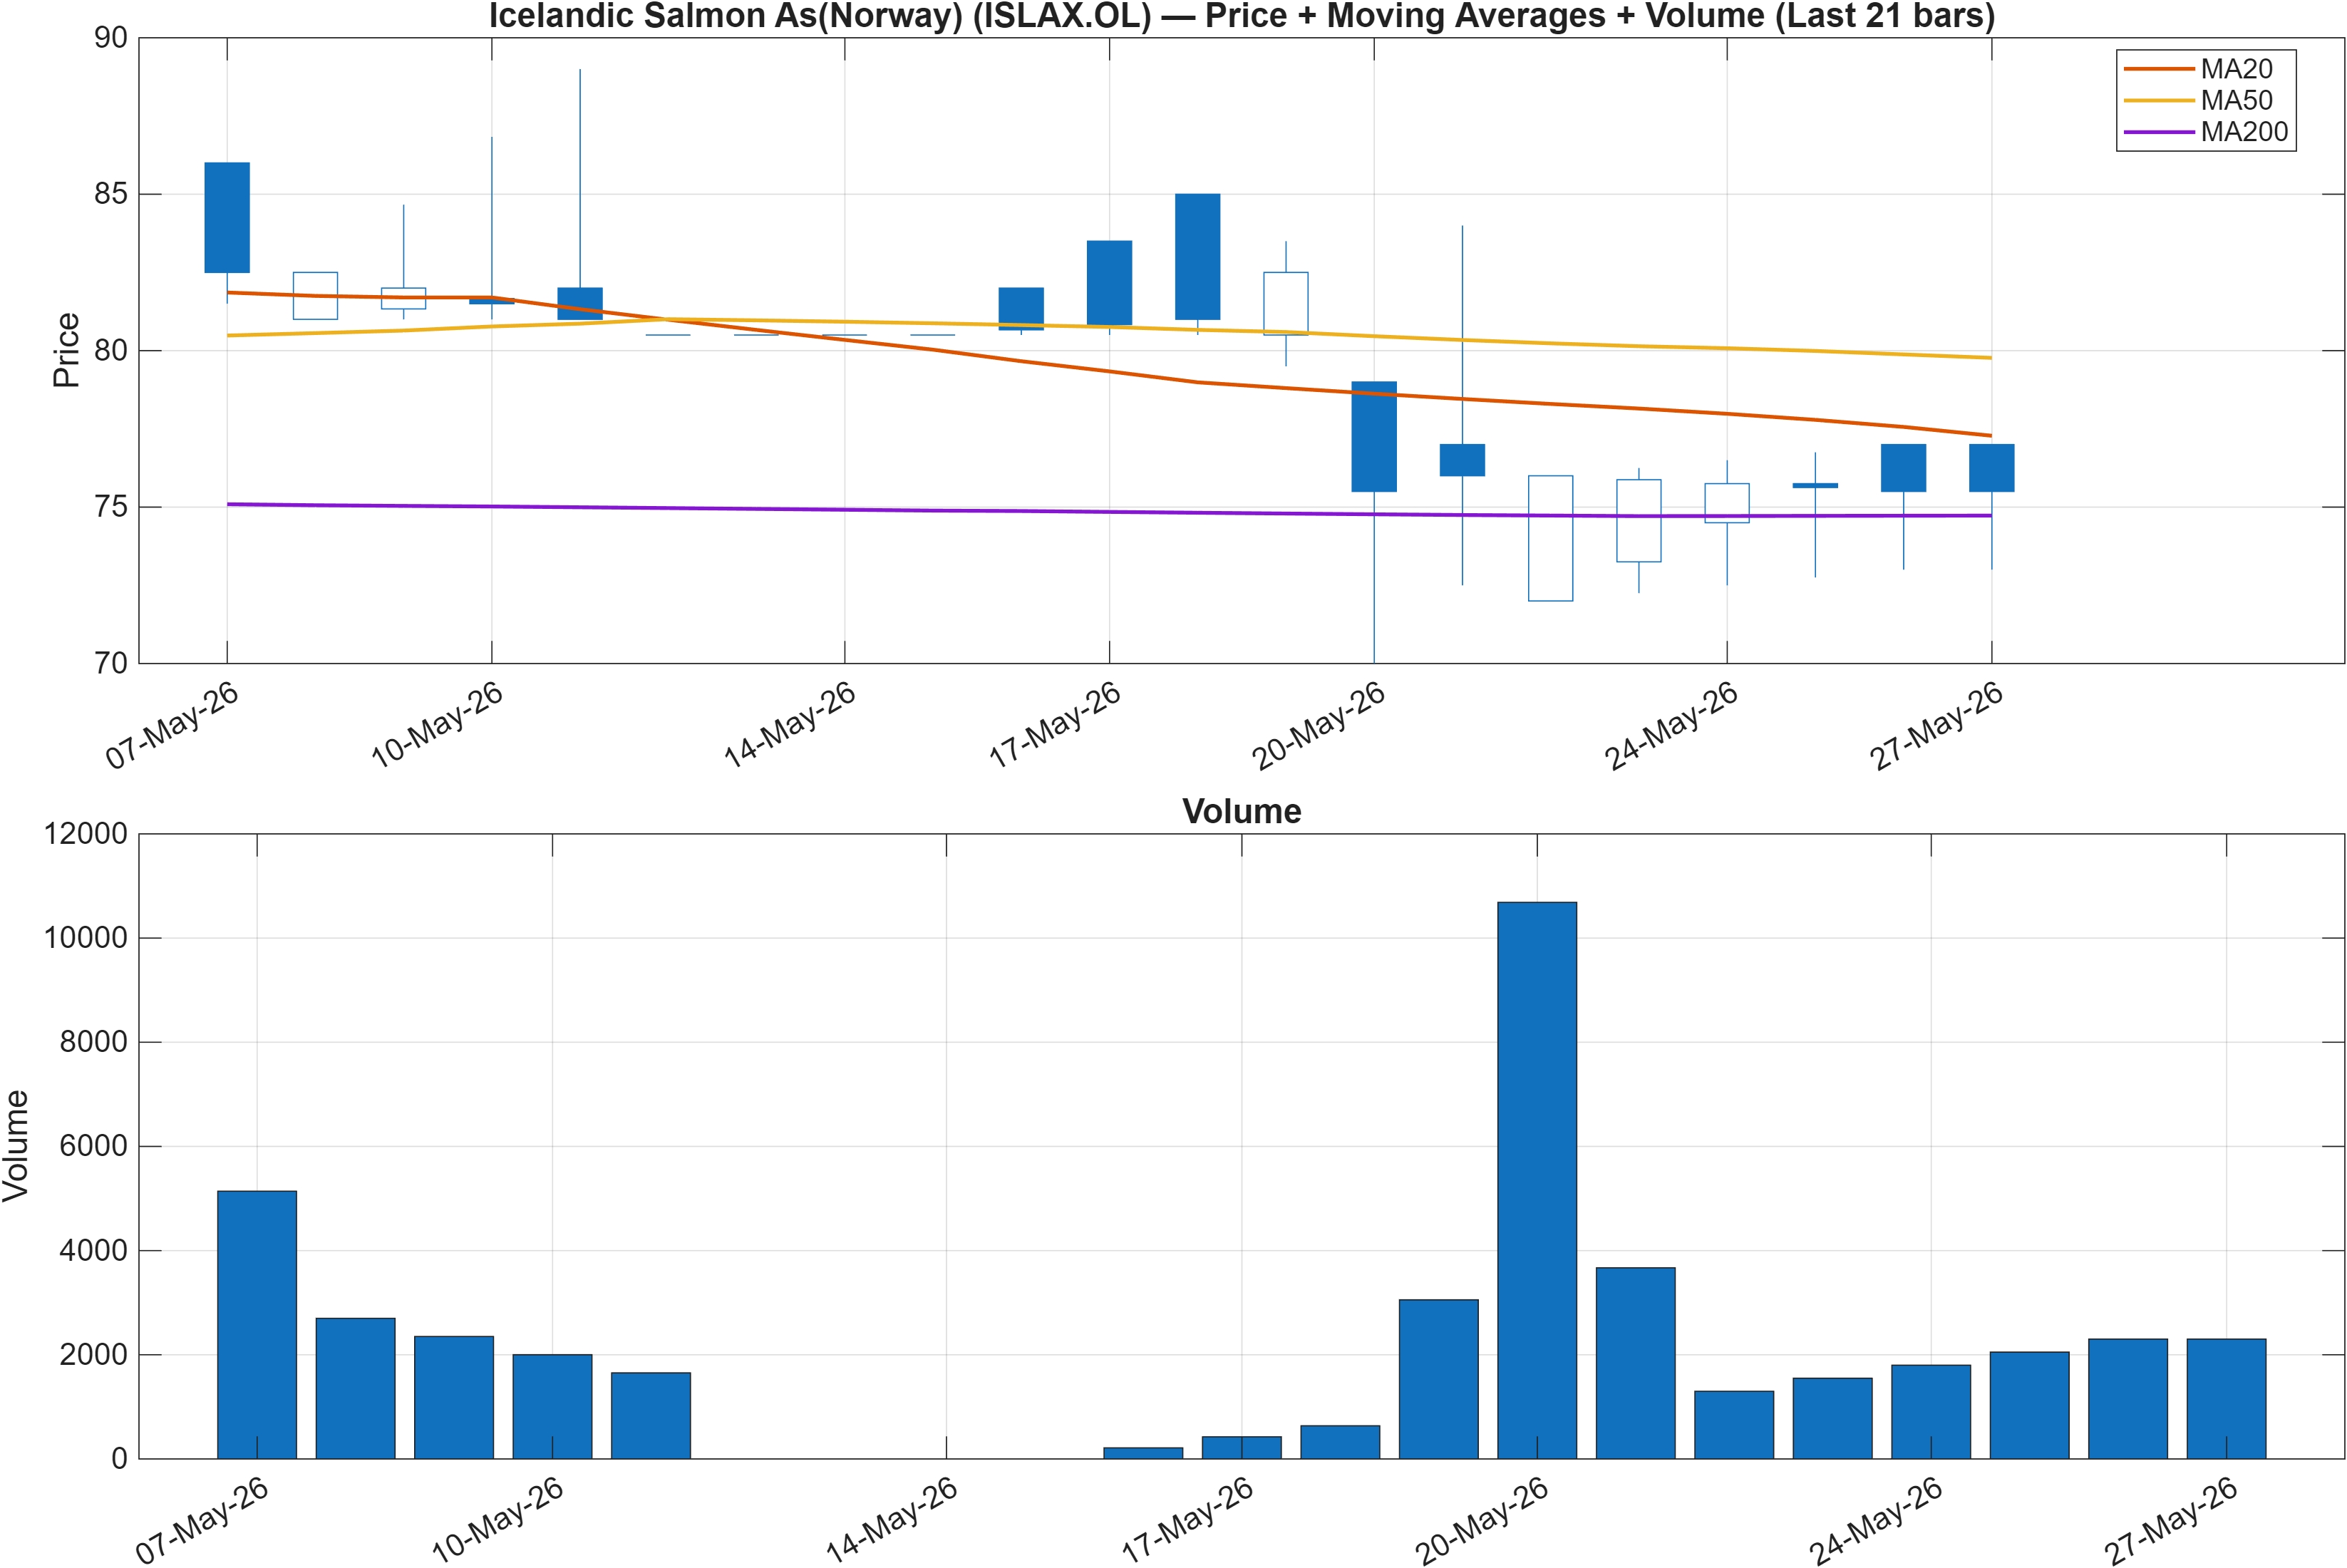
The moving-average configuration signals a cross-current environment. The close is Bearish versus the MA50, while MA50 vs MA200 remains Bullish. This combination is commonly associated with a market that is correcting within a broader uptrend (or attempting to transition back into trend after a drawdown), rather than a uniformly trending state across timeframes.
When shorter-term price action is below the MA50, rallies often require stronger follow-through and cleaner volume confirmation to sustain. At the same time, an MA50 above MA200 can act as a structural “backstop” that slows deterioration and keeps the longer trend from fully breaking—provided that downside momentum does not intensify.
The rank profile reinforces this split: the daily rank (#748) suggests the market is not consistently trending on the shortest horizon, while the monthly rank (#1386) implies that the broader tape has been unfavorable. In that context, the MA cross-state can be read as trend persistence under pressure: the longer moving-average relationship is constructive, but the immediate price position argues that the market still needs to repair.
For decision-making, price behavior around the nearby structural levels in Section 4 becomes more informative than the MA signal alone. If price starts reclaiming the MA50 while maintaining the MA50/MA200 bullish structure, it tends to align better with stabilization. If price continues to fail below the MA50, the probability increases that the MA50/MA200 relationship may eventually compress or reverse.
Interpretation: Close vs MA50 = Bearish, MA50 vs MA200 = Bullish.
3) Momentum & volatility dashboard
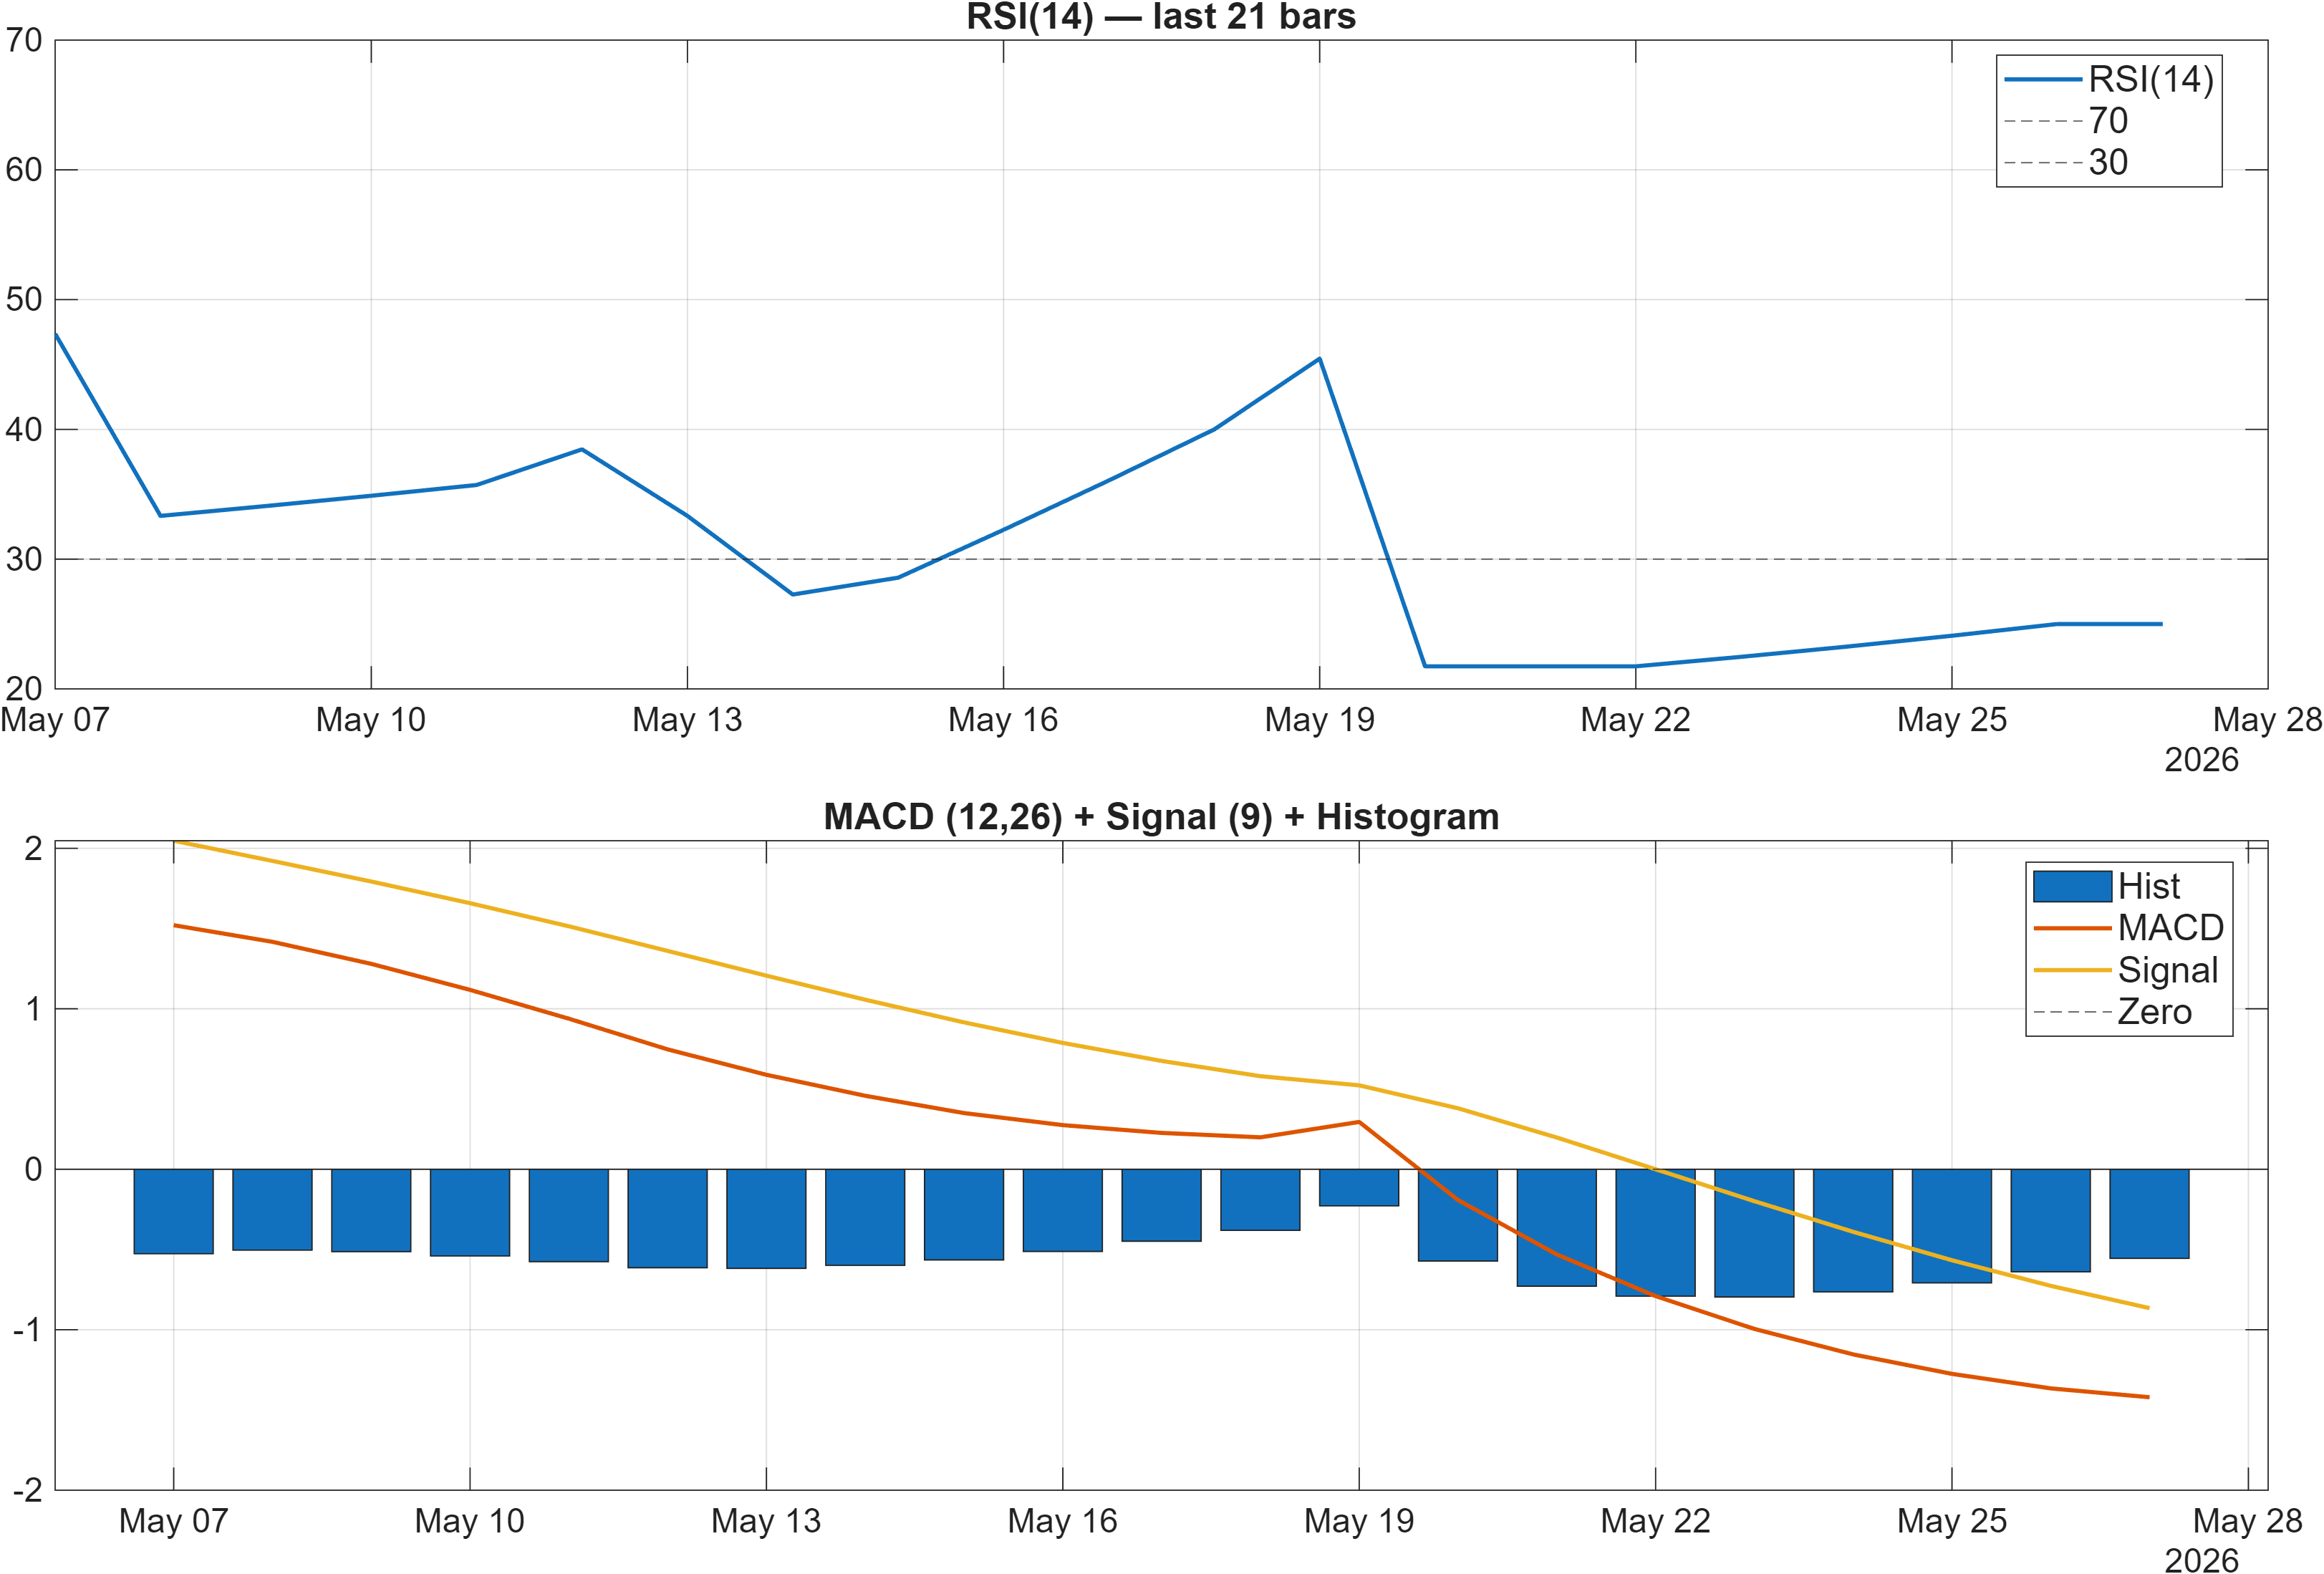
Interpretation: RSI bias = Bearish, MACD hist = -0.5553.
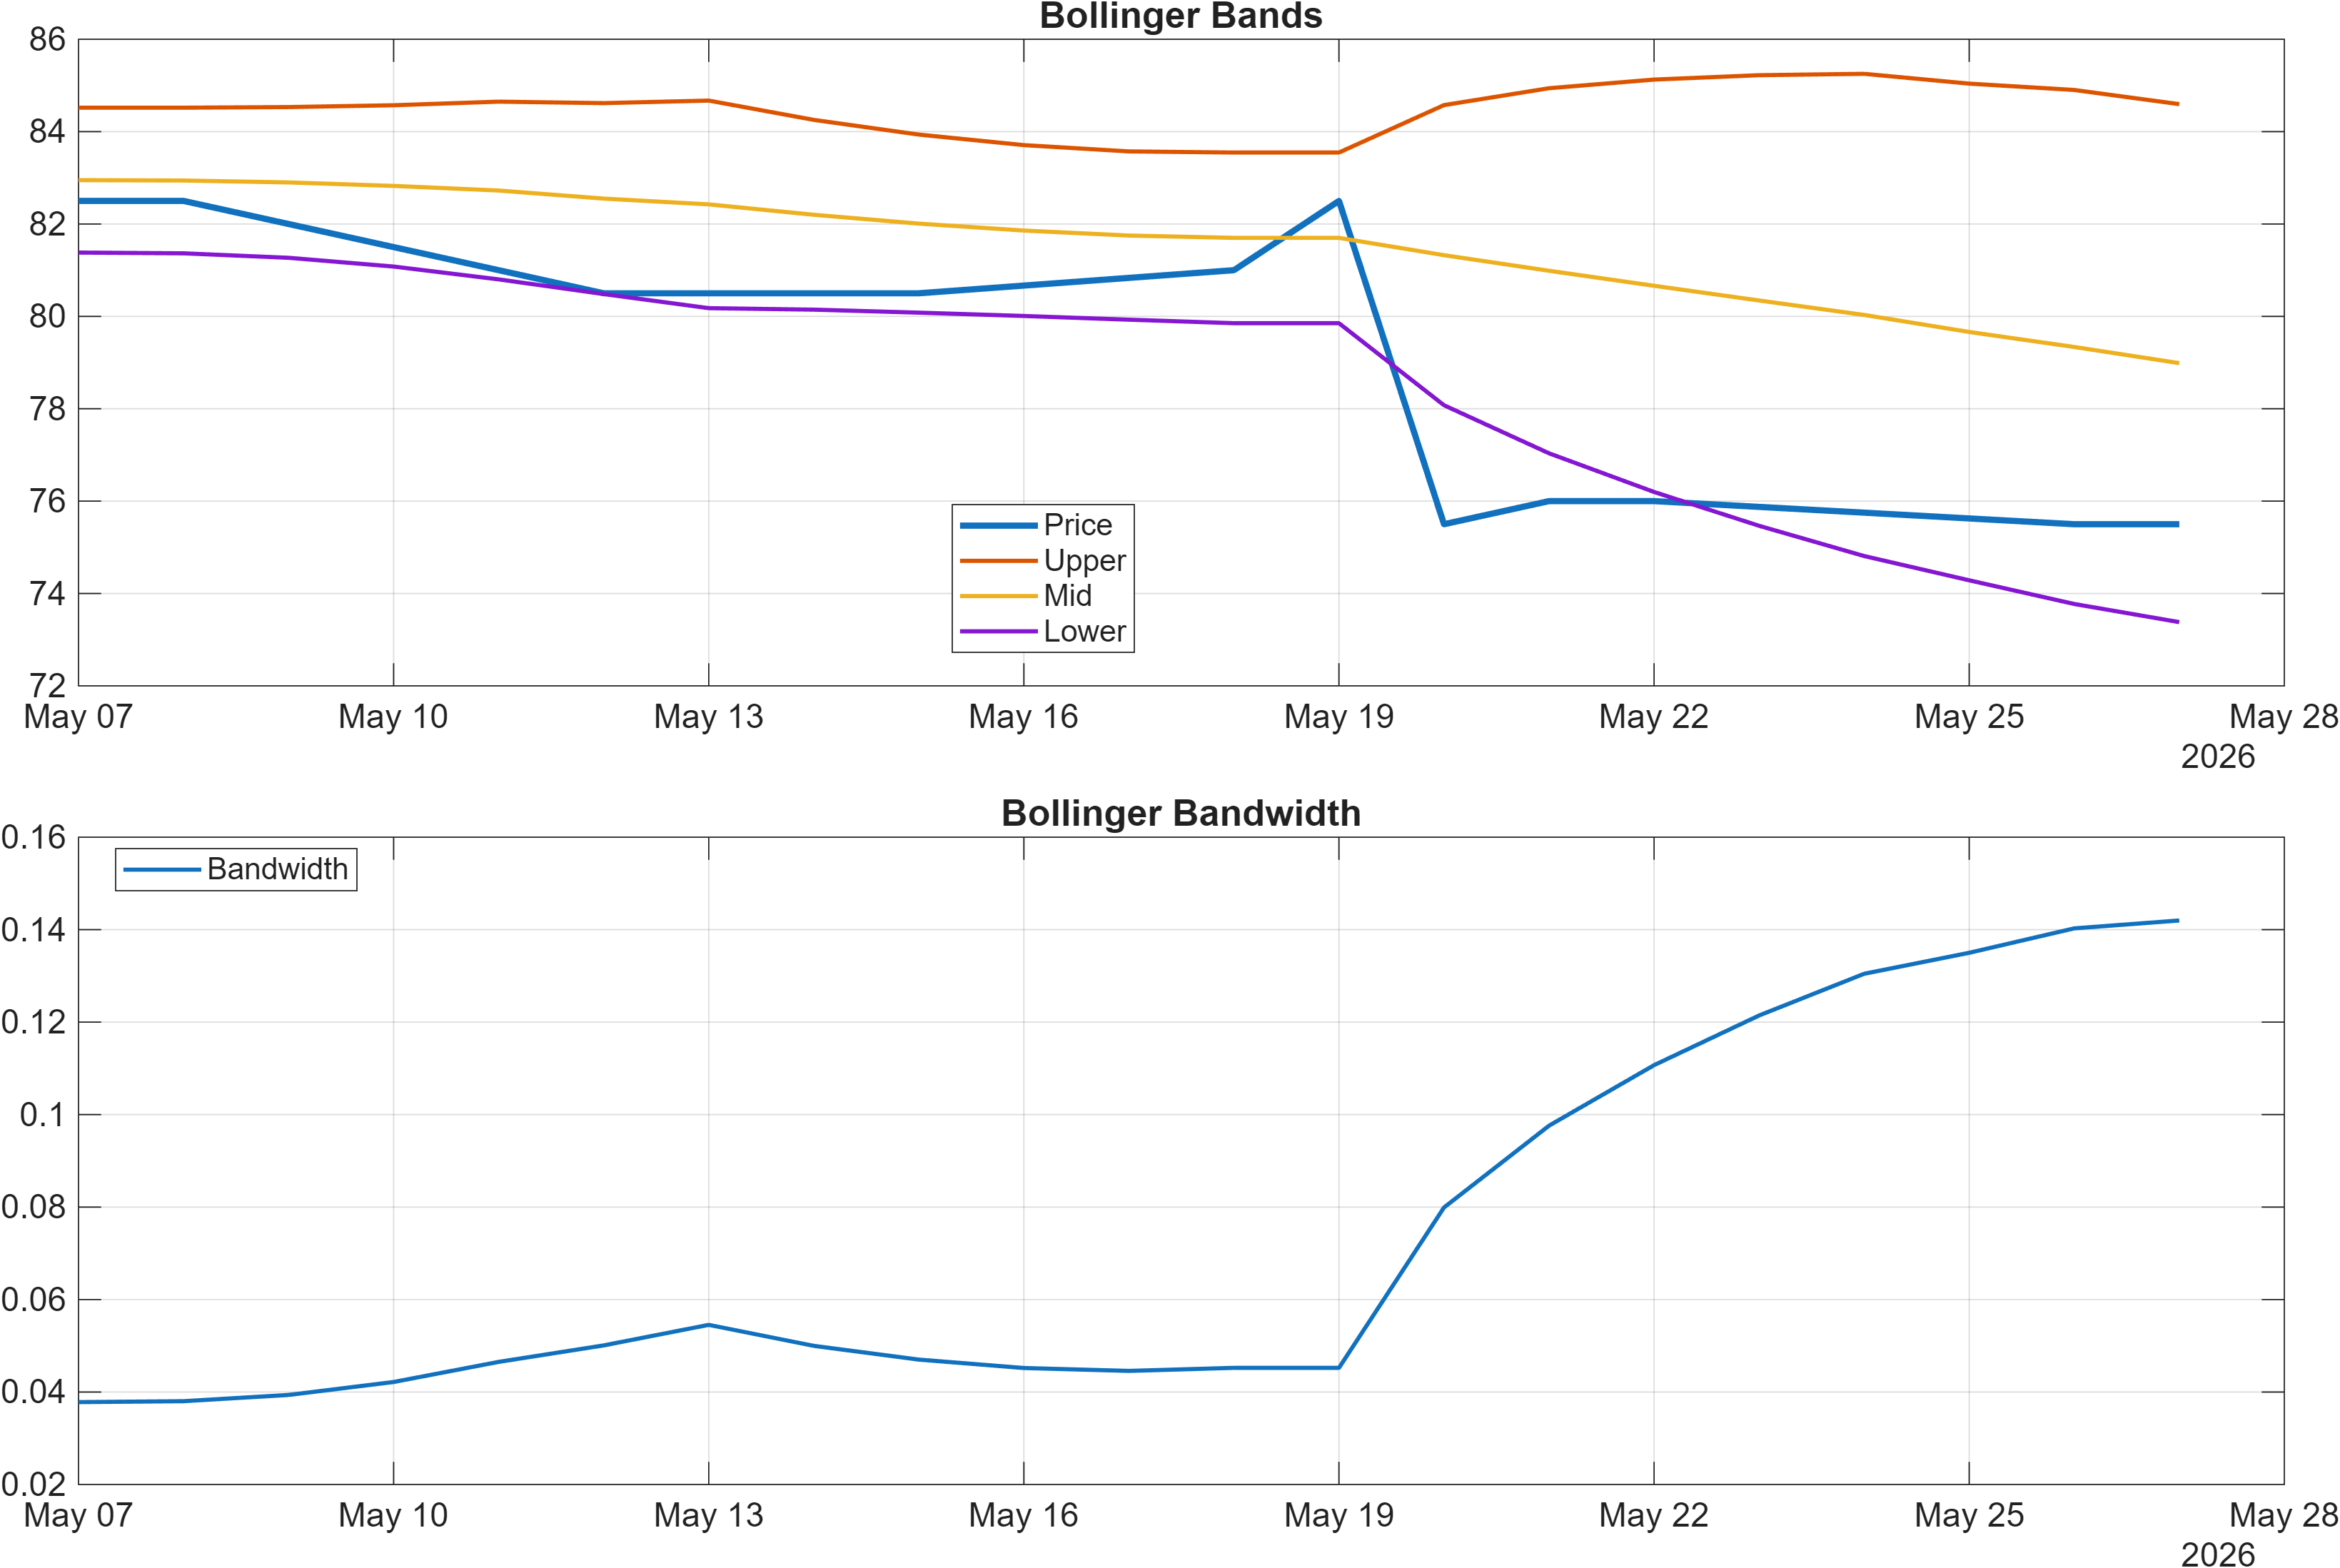
Interpretation: Bandwidth (volatility regime) latest = 0.1420.
Momentum conditions are presently skewed toward downside exhaustion risk rather than upside confirmation. RSI(14) at 25 is consistent with an oversold/pressure regime, and the stated RSI bias is Bearish. Oversold readings can coincide with bounce attempts, but they do not by themselves establish trend reversal—especially when other momentum components remain negative.
The MACD histogram at -0.5553 indicates that negative momentum is still embedded in the tape. In practical signal terms, this suggests that even if price rebounds, the move may initially be better characterized as a mean-reversion attempt unless the MACD structure starts to heal (histogram contraction toward zero is typically the first step).
Volatility provides a separate lens. With Bollinger bandwidth at 0.1420, the current regime does not signal an extreme volatility expansion. That matters because trend changes often emerge either after volatility compresses and then expands, or after a large volatility washout. Here, the bandwidth reading implies a more measured environment: price may still be moving lower, but without a clear volatility “capitulation signature” in the provided metric.
Taken together, the setup is best described as bearish momentum with potential for tactical stabilization if selling pressure fades. Confirmation tends to come from improvements in both momentum (e.g., RSI lifting from depressed levels while MACD histogram improves) and structure (price reclaiming key levels and/or the MA50). Without that, oversold conditions can persist.
4) Support / Resistance zones
Support ~ 68.7083 | Resistance ~ 86.0000
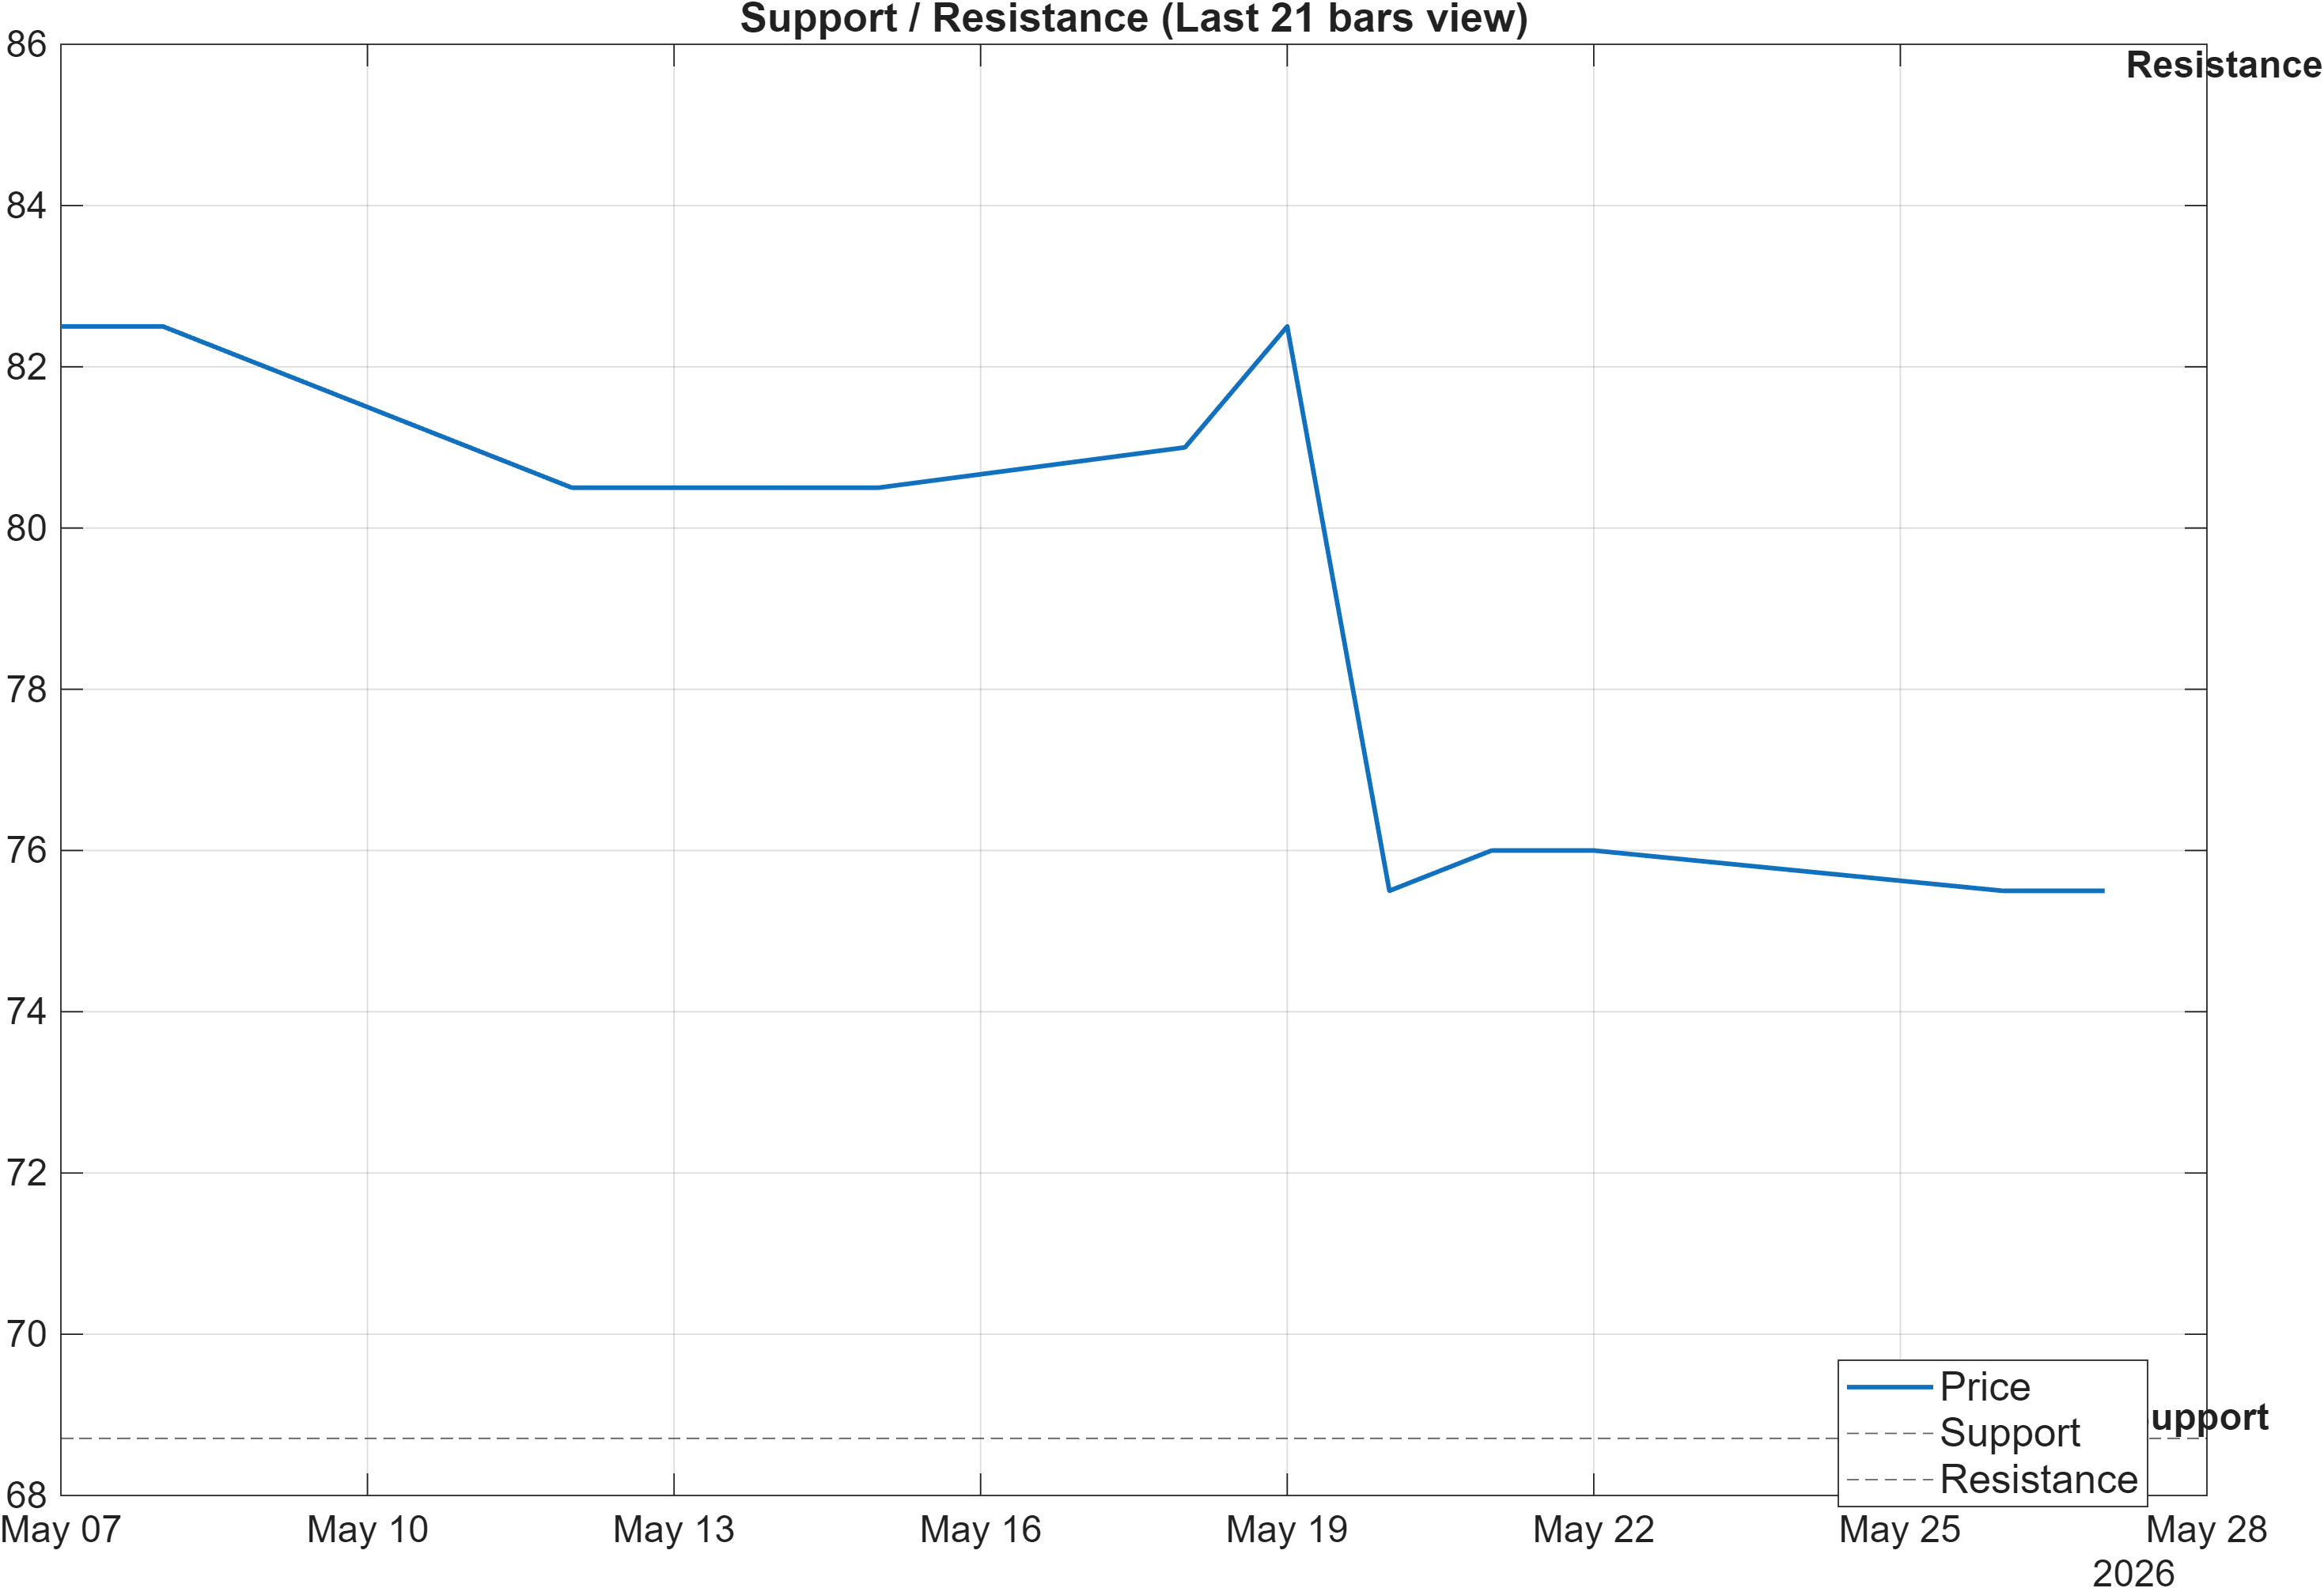
The level map defines a clear risk boundary and upside checkpoint. The support zone near 68.7083 is the market’s primary line for determining whether the recent weakness is stabilizing or transitioning into deeper deterioration. With momentum already soft (e.g., RSI(14) at 25), a clean defense of support can sometimes act as the first ingredient for a base—though it still requires follow-through in trend and breadth signals.
Resistance near 86.0000 represents the opposing decision zone: a level where supply has previously asserted control, and where trend repair must prove itself. Given the bearish technical blend (-0.445) and weak monthly cross-sectional rank (#1386), a move into resistance without broader confirmation may be vulnerable to rejection. Conversely, a sustained break above resistance can act as a structural signal that the market is transitioning out of its lower-quality mid-term regime.
The distance between 68.7083 and 86.0000 also implies a wide operating range, making location particularly important. Near support, the market tends to be evaluated through downside risk control and stabilization evidence (reduced volatility, improving momentum). Near resistance, the evaluation shifts toward breakout quality (volume confirmation, persistence above the level, and improved technical confluence).
In this setup, the most analytically robust “line in the sand” remains the support close criterion: if price closes below 68.7083, it increases the odds that bearish momentum re-accelerates. If price can clear 86.0000 with supportive volume, it would better align the structural picture with the otherwise constructive MA50 vs MA200 relationship.
Scenario view: Break above resistance with volume → continuation. Close below support → signal deterioration risk.
5) Quant Technical Dashboard (18 Signals)
KGNAI AI Technical Analysis Score (Deep Reinforcement Learning): Rank #1205 out of 1414 (Rank 1 represents the strongest technical positioning and a higher probability of favorable price behavior. As ranks increase toward the maximum, the probability of favorable outcomes weakens and bearish positioning becomes more dominant.) | Label: Bearish | Score: -0.704
18-Signal Technical Confluence Score: -0.333 (Bearish)
Overall Technical Score (18-signal confluence + DRL rank blend): -0.445 (Bearish)
Note: The blended score reflects signal strength weighted against broader AI technical ranking, which may temporarily diverge.
Blended technical score breakdown: -0.445 (Bearish | Bull 4 / Bear 10 / Neutral 4)
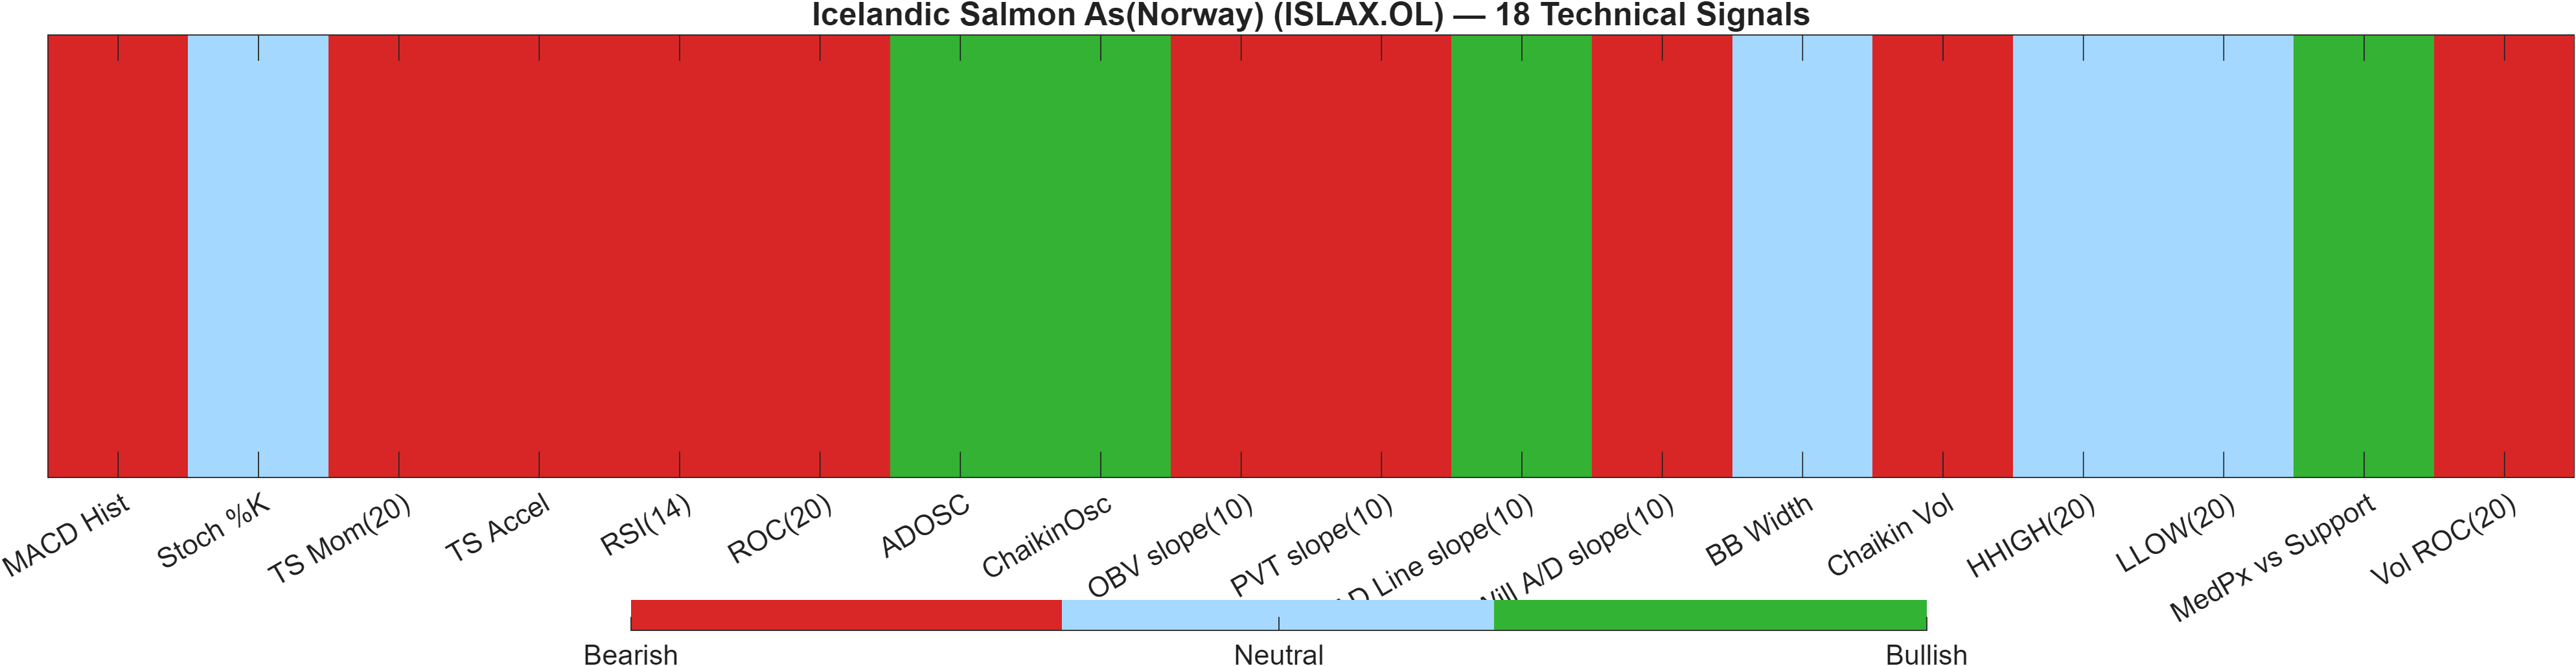
Across the 18-signal set, the market is not merely “soft”—it is broadly negative with a few liquidity/accumulation offsets. The confluence score of -0.333 and the blended overall score of -0.445 both register Bearish, consistent with a signal environment where bearish factors dominate. The distribution (Bull 4 / Bear 10 / Neutral 4) indicates that improvement would likely need to be multi-factor (momentum plus volume/flow plus structure), not a single-indicator fix.
The DRL technical rank at #1205/1414 (score -0.704) reinforces that the broader technical pattern—evaluated against the full universe—remains weak. This matters when considering “oversold” arguments: even with RSI(14) at 25, the ranking model still classifies the instrument as lower quality technically versus peers, suggesting that bounce attempts may be less reliable until the pattern improves.
Within the signal mix, negative momentum is visible via MACD histogram -0.5553 and other momentum-related readings, while volatility is comparatively neutral (e.g., BB Width 0.142 shows Neutral). That combination can produce choppy rebounds that fail to transition into trend unless accompanied by stronger participation.
The existence of some bullish flow/accumulation flags (as reflected in the table) should be treated as a conditional counter-signal: it may indicate selective buying interest, but it has not yet outweighed the broader bearish stack. For higher confidence, the technical blend would need to move away from -0.445 while price works toward the resistance framework in Section 4.
Signal table (Bull/Bear/Neutral)
| Indicator | Value | Signal |
|---|---|---|
| MACD Hist | -0.5553 | Bearish |
| Stoch %K | 36.67 | Neutral |
| TS Mom(20) | -7 | Bearish |
| TS Accel | -6.667 | Bearish |
| RSI(14) | 25 | Bearish |
| ROC(20) | -8.485 | Bearish |
| ADOSC | 31.25 | Bullish |
| ChaikinOsc | 2340 | Bullish |
| OBV slope(10) | -1.102e+04 | Bearish |
| PVT slope(10) | -837.2 | Bearish |
| AD Line slope(10) | 7701 | Bullish |
| Will A/D slope(10) | -3.75 | Bearish |
| BB Width | 0.142 | Neutral |
| Chaikin Vol | 69.94 | Bearish |
| HHIGH(20) | 89 | Neutral |
| LLOW(20) | 70 | Neutral |
| MedPx vs Support | 6.292 | Bullish |
| Vol ROC(20) | -14.78 | Bearish |
Interpretation: Indicator-level signals form the base confluence, which is then adjusted using a separate AI-driven technical ranking model. The final technical score summarizes this combined view.
6) News sentiment + extractive gist
Sentiment score (avg): 0.209 | Positive: 100% | Neutral: 0% | Negative: 0%
KGNAI AI News Sentiment Score (normalized -1 to +1): 1.00 (as of 2026-05-21) | Label: Bullish | Overall news score: 1.00
Positive Developments
Recent coverage across major financial outlets indicates a constructive information flow around corporate communications and reporting cadence. The sentiment profile is unambiguously positive in the provided dataset—100% positive items, an average sentiment score of 0.209, and a normalized sentiment score of 1.00 (as of 2026-05-21). The underlying themes referenced are consistent with routine investor-facing updates (including annual reporting) and discussion of operational context, which can reduce uncertainty for market participants when disclosures are timely and comprehensive. In isolation, this is a supportive backdrop; however, the price/technical layer remains cautious (e.g., MACD histogram -0.5553 and a Bearish overall technical score of -0.445). The analytical implication is that sentiment is currently providing a favorable narrative bias, but it still needs confirmation through improved market structure (reclaiming resistance and improving momentum) before it can be considered aligned with price behavior.
Neutral / Mixed Developments
The same news set also reads as mixed when filtered for market impact: much of the content appears informational in nature, overlapping across categories in the input and therefore likely reflecting limited incremental surprise. Even with a Bullish normalized reading of 1.00, sentiment can cluster positively during periods when investors are simply receiving scheduled disclosures rather than genuinely new catalysts. In that situation, markets may respond more to liquidity, risk appetite, and technical positioning than to the tone of commentary. This helps explain how a positive sentiment stack can coexist with weaker technical alignment such as the DRL technical rank at #1205/1414. From a process standpoint, the higher-value interpretation is to treat sentiment as context while letting price resolve around the defined zones: 68.7083 (support) and 86.0000 (resistance).
Negative / Risk Signals
The principal risk signal is not negative headlines in the provided data (none are scored negative), but rather the potential mismatch between upbeat sentiment and bearish market internals. With RSI(14) at 25 and an overall technical blend of -0.445, the tape is still pricing in stress despite the favorable news tone. When this divergence persists, it can indicate that market participants are prioritizing technical damage, positioning, or risk constraints over narrative. A second risk is that repetitive or overlapping informational items can inflate “positive share” statistics without materially changing investor expectations. Finally, the monthly rank at #1386/1414 suggests the instrument remains in a weak cross-sectional bucket, which can limit the durability of sentiment-led rallies unless price begins to regain traction above key resistance.
- What to monitor next: Acceptance/rejection behavior at 86.0000 and whether volume supports a breakout attempt.
- What to monitor next: Whether momentum improves (e.g., MACD histogram moving toward zero while RSI lifts off 25).
- What to monitor next: Any close below 68.7083, which would undermine stabilization despite positive sentiment.
Snapshot: AI Rank (Short–Mid–Long): Mixed (Neutral–Bearish–Not available) · Technical Confluence: Bearish · Key Levels: Support ~68.71 | Resistance ~86.00 · News Sentiment: Positive
Sources referenced: Reuters, Bloomberg, Yahoo Finance, MarketWatch, Investing.com
7) Sources
- Icelandic Salmon - Annual Report 2025 — https://finance.yahoo.com/markets/stocks/articles/icelandic-salmon-annual-report-2025-053000802.html?.tsrc=rss
- Icelandic Salmon AS (OISE:ISLAX) Q3 2025 Earnings Call Highlights: Navigating Challenges with ... — https://finance.yahoo.com/news/icelandic-salmon-oise-islax-q3-010054147.html?.tsrc=rss
You may also like: How KGNAI AI ranks instruments across global markets
Disclaimer: KGNAI provides AI-generated analytics and educational market commentary only. This is not financial advice. Markets involve risk. Always do your own research.