
TotalEnergies SE (TTE.PA) — 29-May-2026 Quant Signal Mix Indicates No Clear Trend Resolution
TotalEnergies SE (TTE.PA) enters 29-May-2026 with a cross-horizon rank split that argues against a single directional thesis. The Daily rank (#221/1412) and longer-window ranks (notably 3-Monthly #218 and 6-Monthly #183) lean constructive, yet the Weekly rank (#1224) sits deep in the lower tail of the universe, consistent with near-term fragility. Technically, the dashboard is more uniformly cautious: the 18-signal confluence and the blended view remain Bearish, reinforced by MACD histogram at -0.4864 and an RSI(14) at 31.56. Volatility is not currently extreme, with Bollinger Bandwidth at 0.0787, implying that any regime shift may require a catalyst and confirmation at key levels. The market is also balancing a positive news sentiment bias (avg 0.211; normalized 1.00) against an unresolved price/indicator structure.
- Short / Mid / Long rank stance: Short-term Bearish · Mid-term Neutral · Long-term Neutral
- Technical confluence label: Bearish (Overall Technical Score -0.521; DRL rank #1291/1412)
- Key levels: Support ~ 74.1750 · Resistance ~ 80.3260
- News sentiment bias: Bullish (normalized 1.00; Positive 62%)
- Confirmation / invalidation condition: Follow-through improves on a break above 80.3260 with volume; risk increases on a close below 74.1750.
KGNAI evaluates assets using large cross-sectional datasets built from millions of structured data points. Inputs incorporate fundamental metrics, technical structures, and systematically processed news sentiment. Statistical models, machine learning, and AI frameworks are used to assess relative positioning, signal alignment, and probabilistic behavior across broad universes.
- Ranks are comparative across the tracked universe, not absolute price targets.
- Confluence reflects alignment among independent signal groups.
- Support/resistance levels are probabilistic decision zones, not guarantees.
- Sentiment provides contextual bias within the broader analytical framework.
1) KGNAI AI Analysis
Region: EUROPE
Total universe size: 1412 ranked instruments
- Daily rank: #221 out of 1412 — Bullish
- Weekly rank: #1224 out of 1412 — Bearish
- Monthly rank: #324 out of 1412 — Neutral
- 3-Monthly rank: #218 out of 1412 — Bullish
- 6-Monthly rank: #183 out of 1412 — Bullish
- Yearly rank: #300 out of 1412 — Neutral
The rank profile for TotalEnergies SE (TTE.PA) is best read as time-horizon disagreement. The Daily rank (#221) sits in the upper portion of the universe (roughly top quintile), which typically aligns with nearer-term relative strength versus peers. However, the Weekly rank (#1224) is in the lower tail, signaling that the most recent weekly regime has not stabilized and remains vulnerable to failed rebounds.
This split matters because the longer windows are not uniformly weak: the 3-Monthly (#218) and 6-Monthly (#183) ranks are again in the upper tier, suggesting the broader structure has not fully deteriorated despite the weekly softness. Meanwhile, the Monthly rank (#324) and Yearly rank (#300) sit closer to the middle of the distribution, consistent with a market that is neither cleanly trending nor fully mean-reverting across the longest window tracked here.
The declared term view—Short-term: Bearish; Mid-term: Neutral; Long-term: Neutral—is consistent with that cross-horizon profile: short-run pressure is present, but the longer-run ranking does not corroborate a persistent downtrend thesis. For positioning discipline, the practical implication is that signal confirmation should be demanded before treating any single-horizon strength as durable, especially while the weekly ranking remains deeply weak relative to the 1412-instrument peer set.
Want the full universe and complete rank tables? Unlock full access on KGNAI: https://www.kgnai.com/pricing
2) Price & trend overview
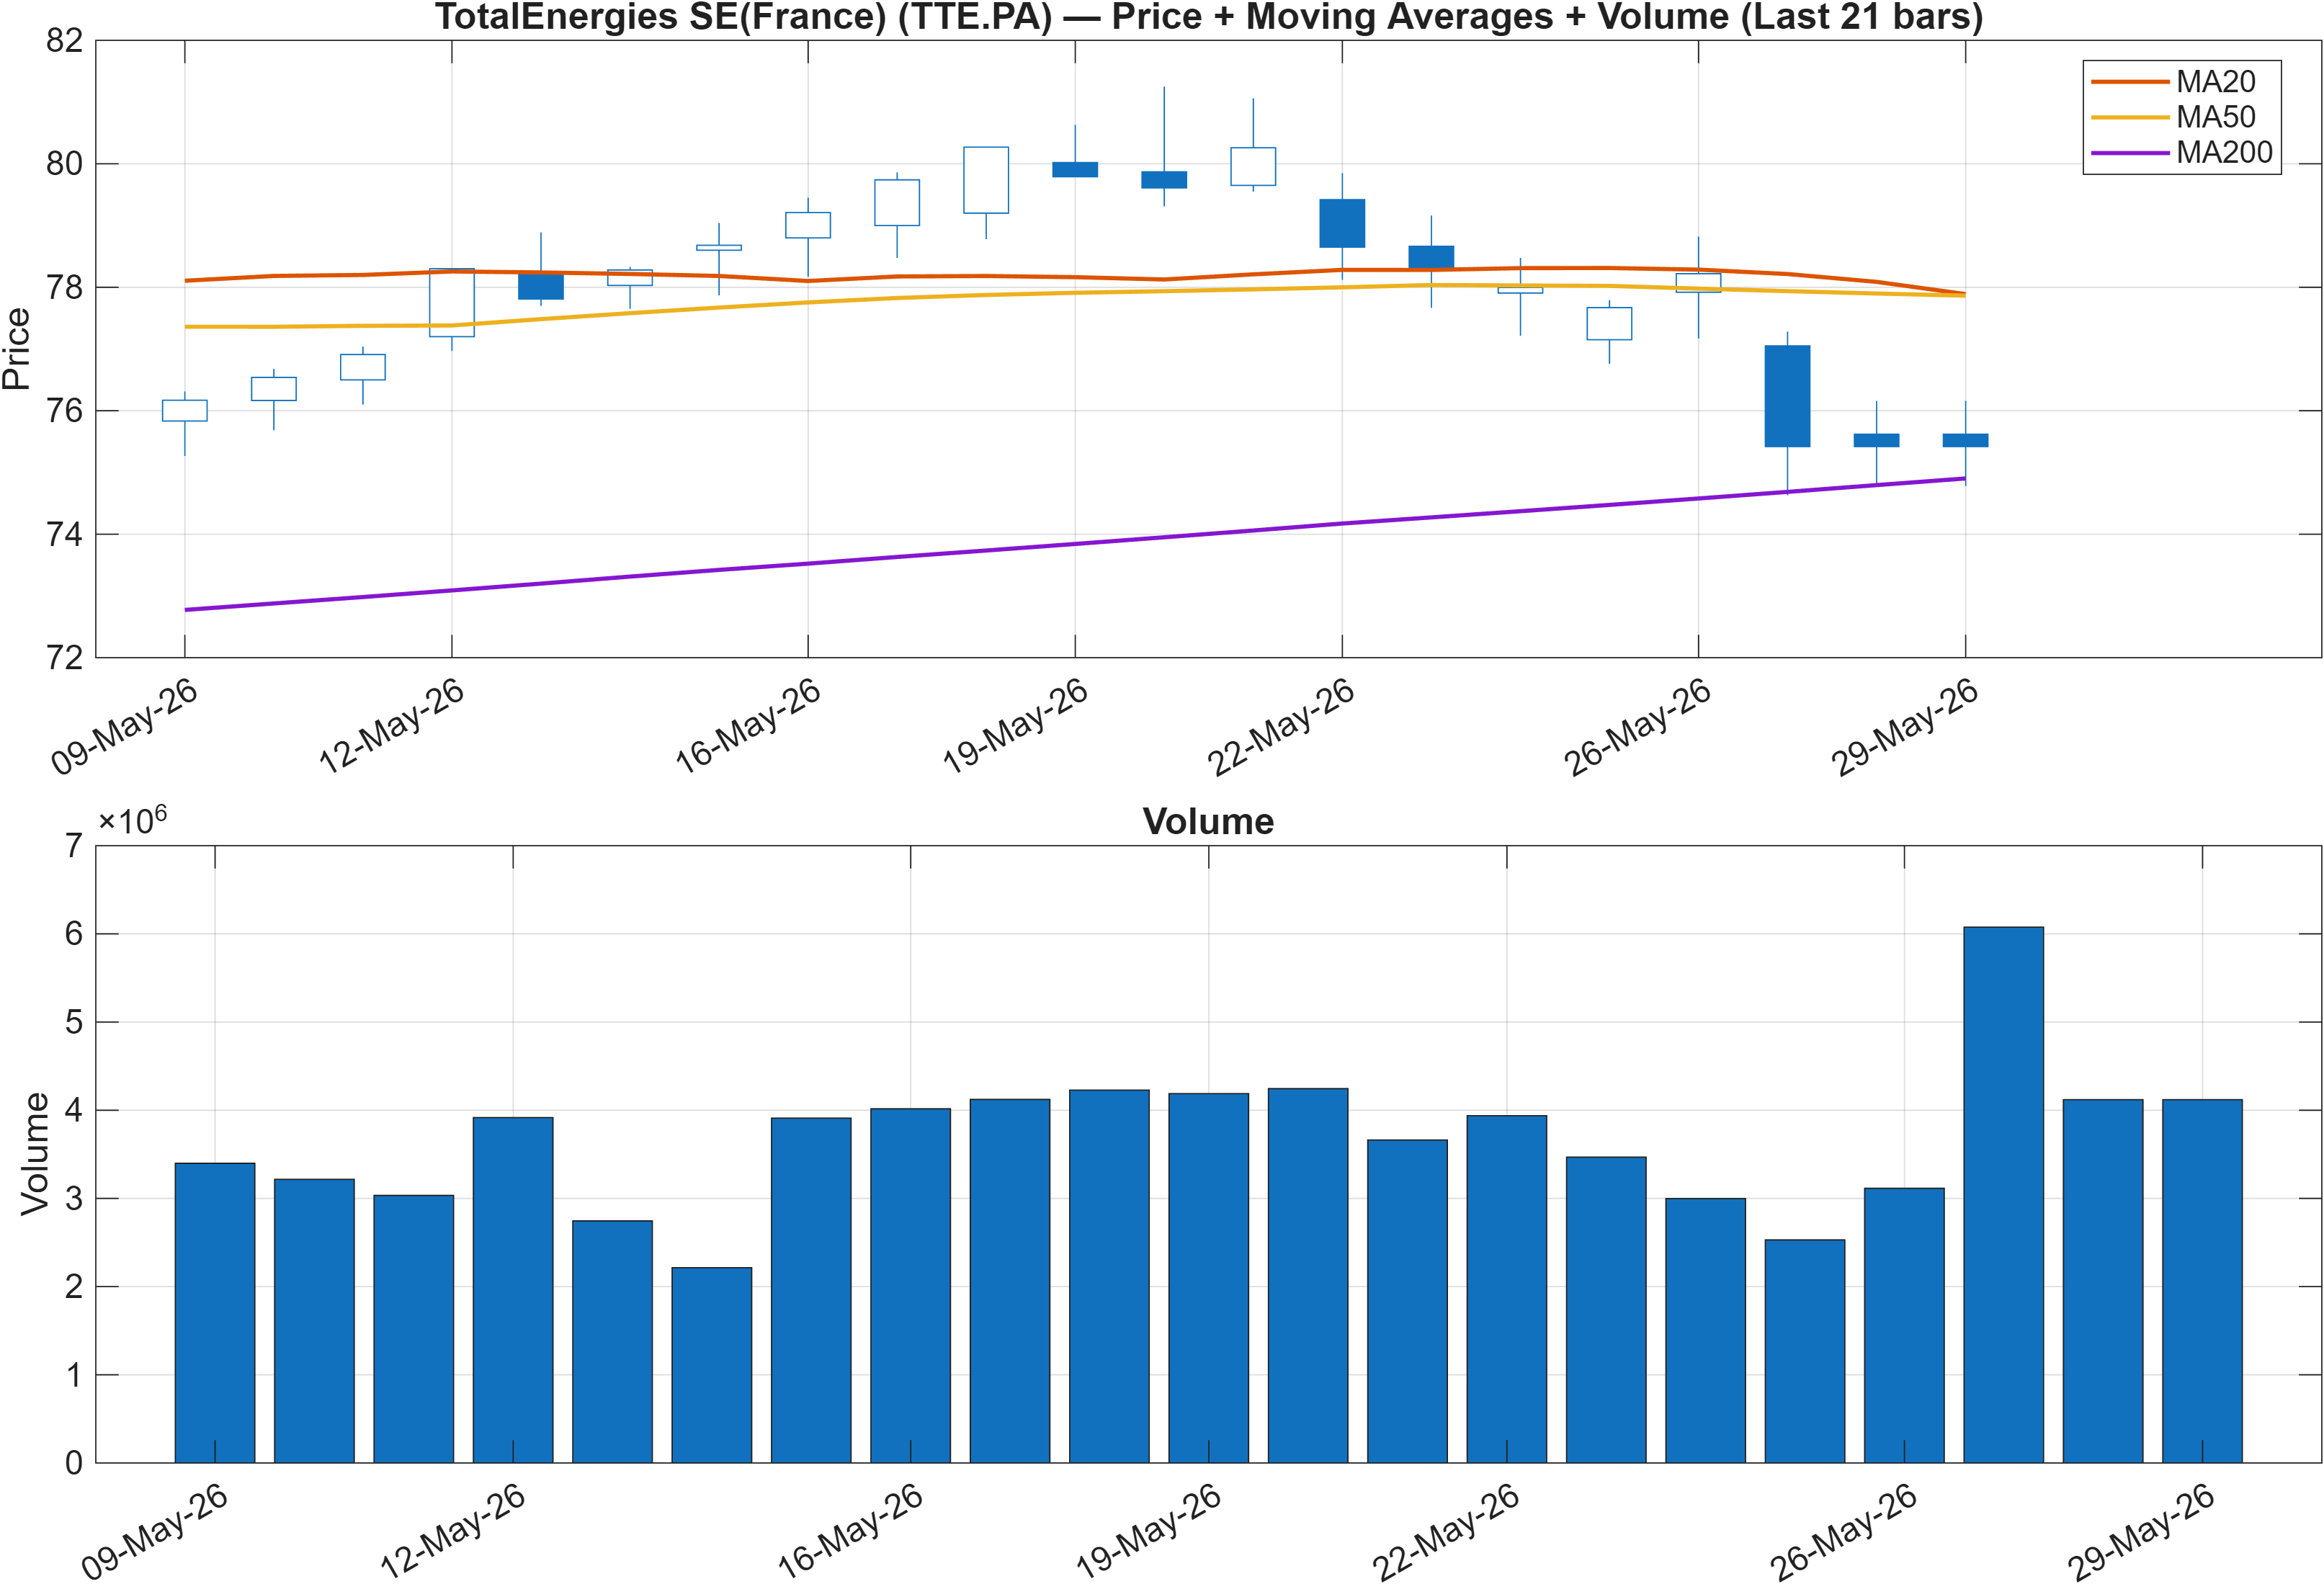
Trend diagnostics show a mixed moving-average configuration, which is often where false breakouts cluster. The close is below the MA50 (Bearish), reflecting immediate weakness and an inability to hold intermediate trend support. At the same time, the MA50 vs MA200 relationship is Bullish, which usually indicates that the longer-cycle structure has not fully rolled over.
When these two conditions coexist, markets often oscillate between counter-trend rebounds and renewed pullbacks until a clearer regime emerges. In that context, the wider report’s cross-horizon ranks provide a useful frame: the constructive Daily rank (#221) can align with sharp reflex rallies, while the heavily weak Weekly rank (#1224) warns those rallies may fade unless they produce sustained follow-through.
From a level-based perspective, the nearby zone structure is well defined, with support around 74.1750 and resistance around 80.3260 (see Section 4). In mixed MA states, these reference points frequently become the “proof points” for whether the tape is transitioning into a renewed trend or remaining range-bound. The more compressed volatility reading later in the dashboard (Bandwidth 0.0787) reinforces that a larger directional move may require a decisive push through those boundaries rather than incremental drift.
Overall, the price/trend view supports the title stance: the market is not offering a clean trend resolution yet, and the immediate task is to distinguish a temporary dip below MA50 from the start of a deeper structural break.
3) Momentum & volatility dashboard
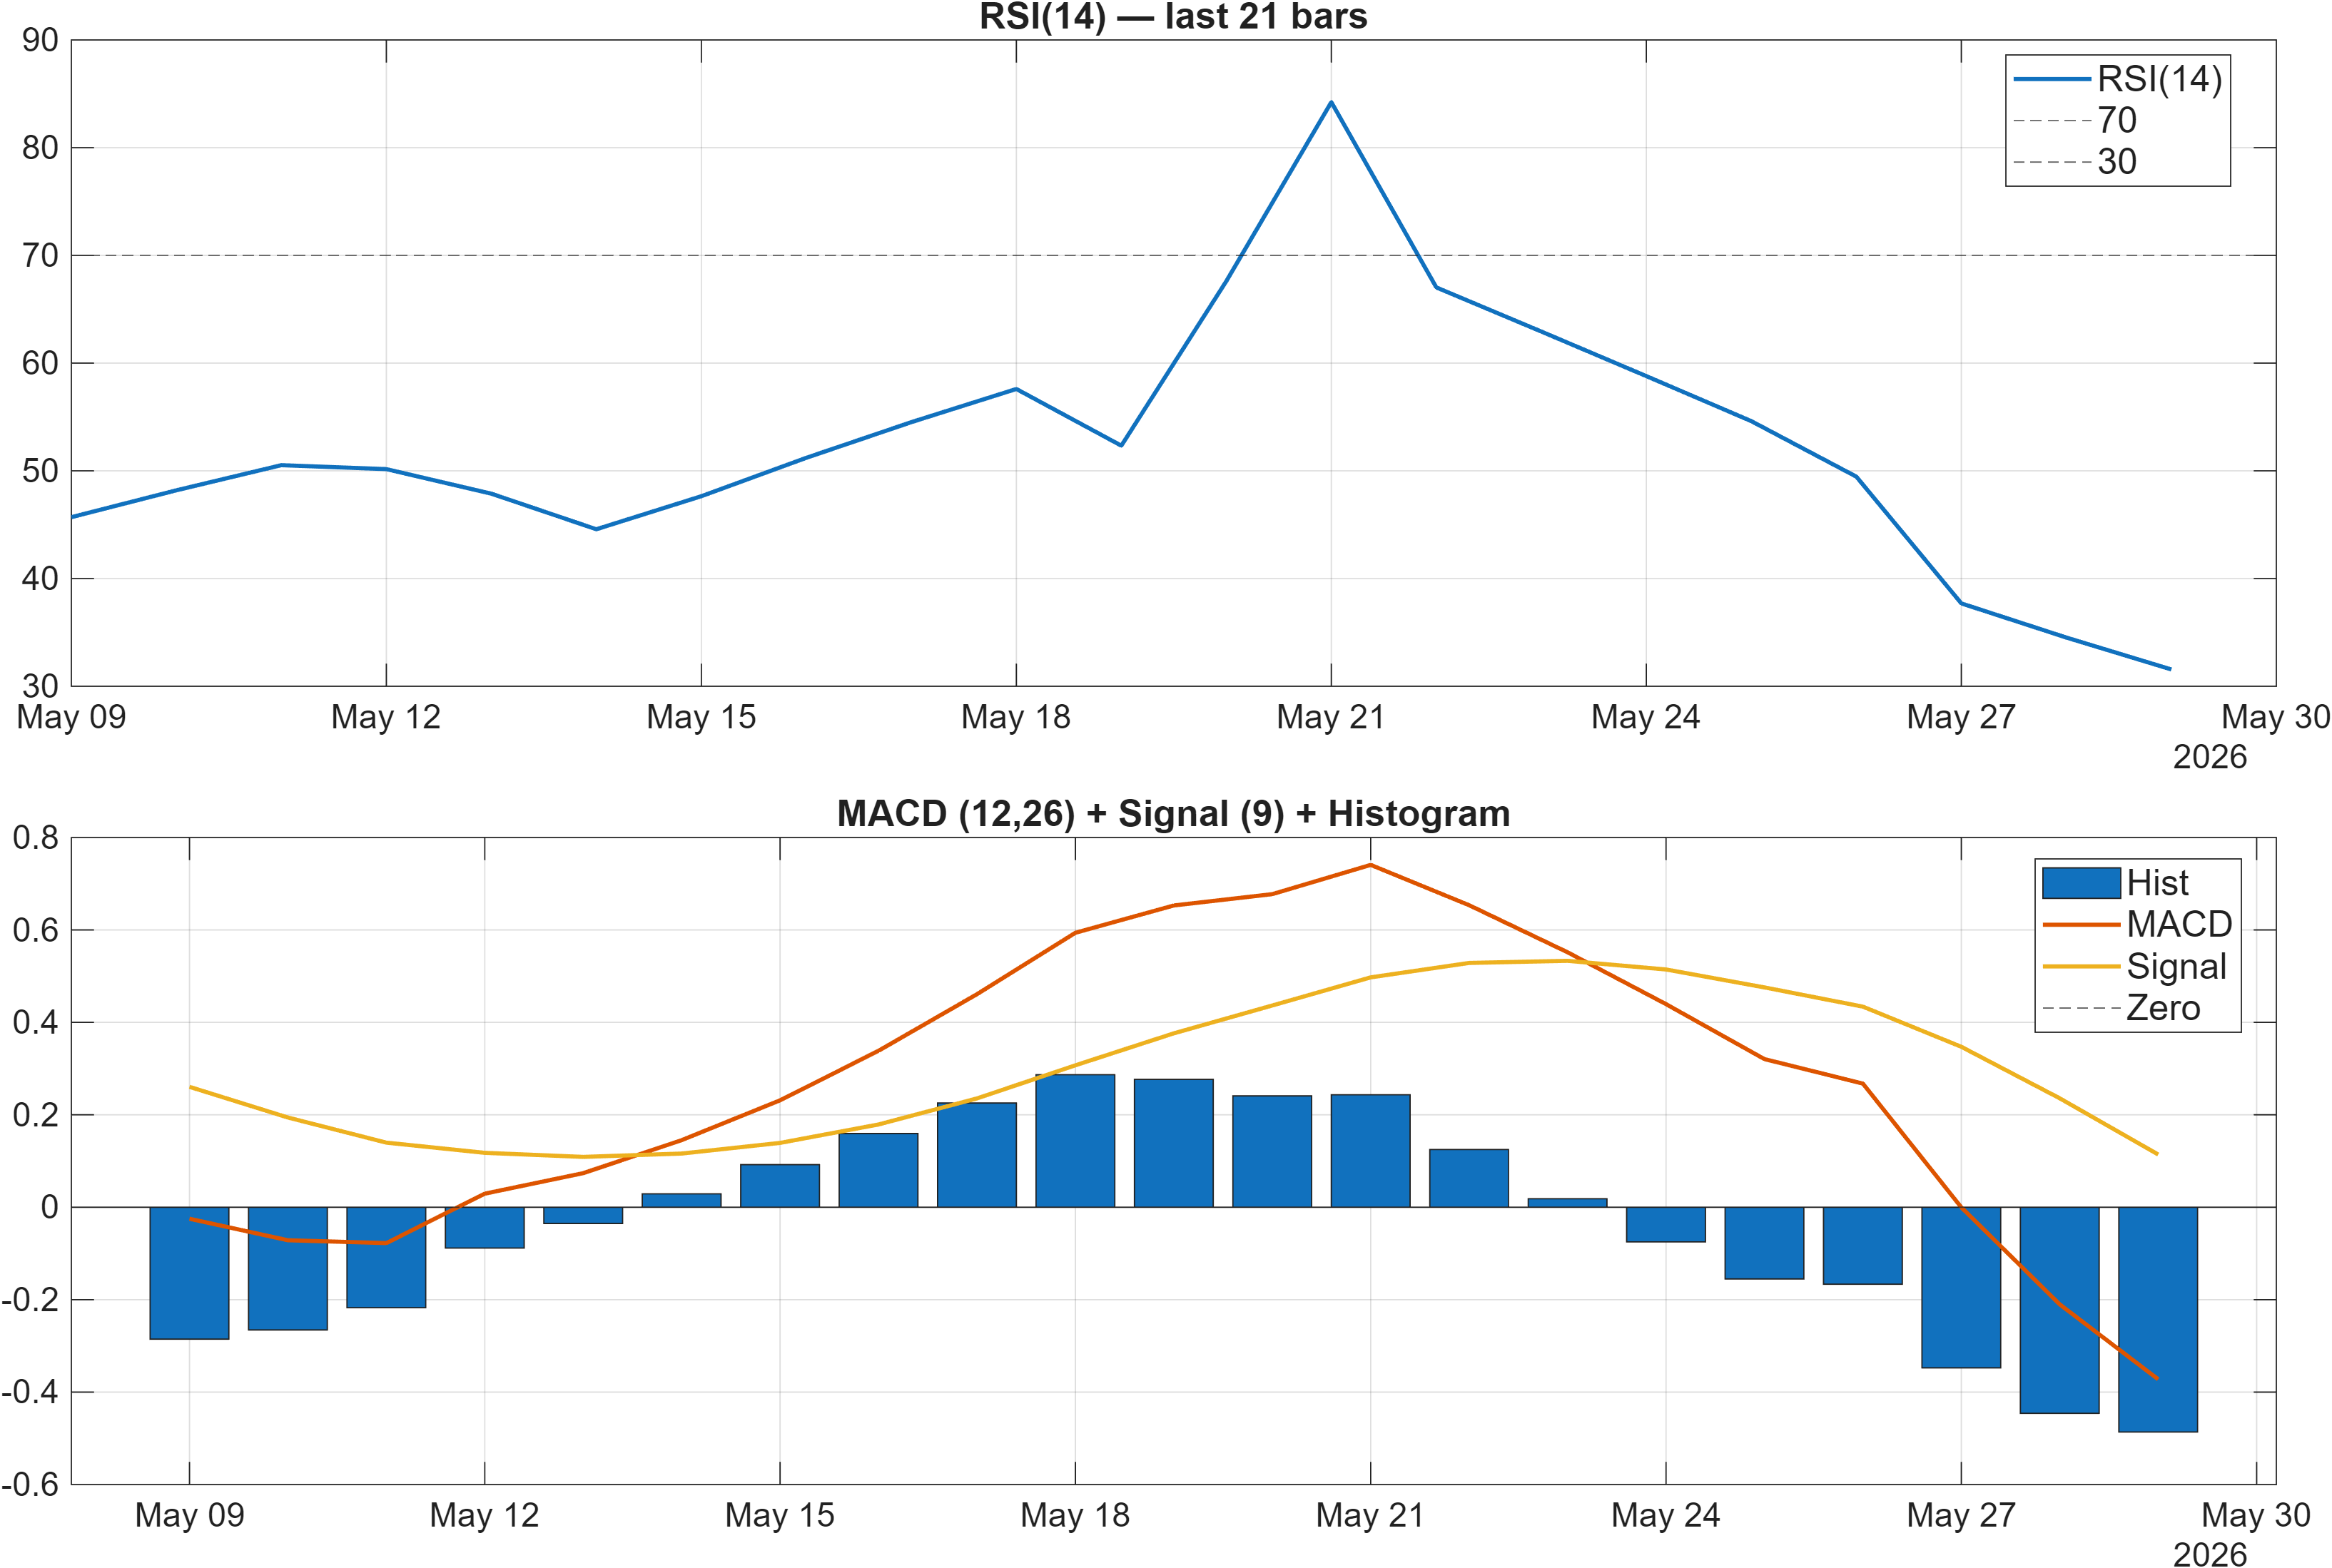
Momentum readings lean cautious, but the internal composition suggests late-stage downside pressure rather than a fresh acceleration. The RSI(14) at 31.56 is explicitly flagged Bearish, placing the oscillator near the lower end of its typical range and consistent with constrained upside responsiveness. In parallel, the MACD histogram at -0.4864 remains negative, indicating that downside momentum has not been fully neutralized.
However, the signal table introduces an important nuance: Stoch %K at 11.93 is labeled Bullish. This is the sort of divergence that often appears when price is oversold on faster oscillators even while trend-following momentum (MACD) still points down. In practice, this combination can produce short-lived rebounds that do not automatically translate into a durable trend shift—especially when the MA framework is mixed (close vs MA50 Bearish; MA50 vs MA200 Bullish).
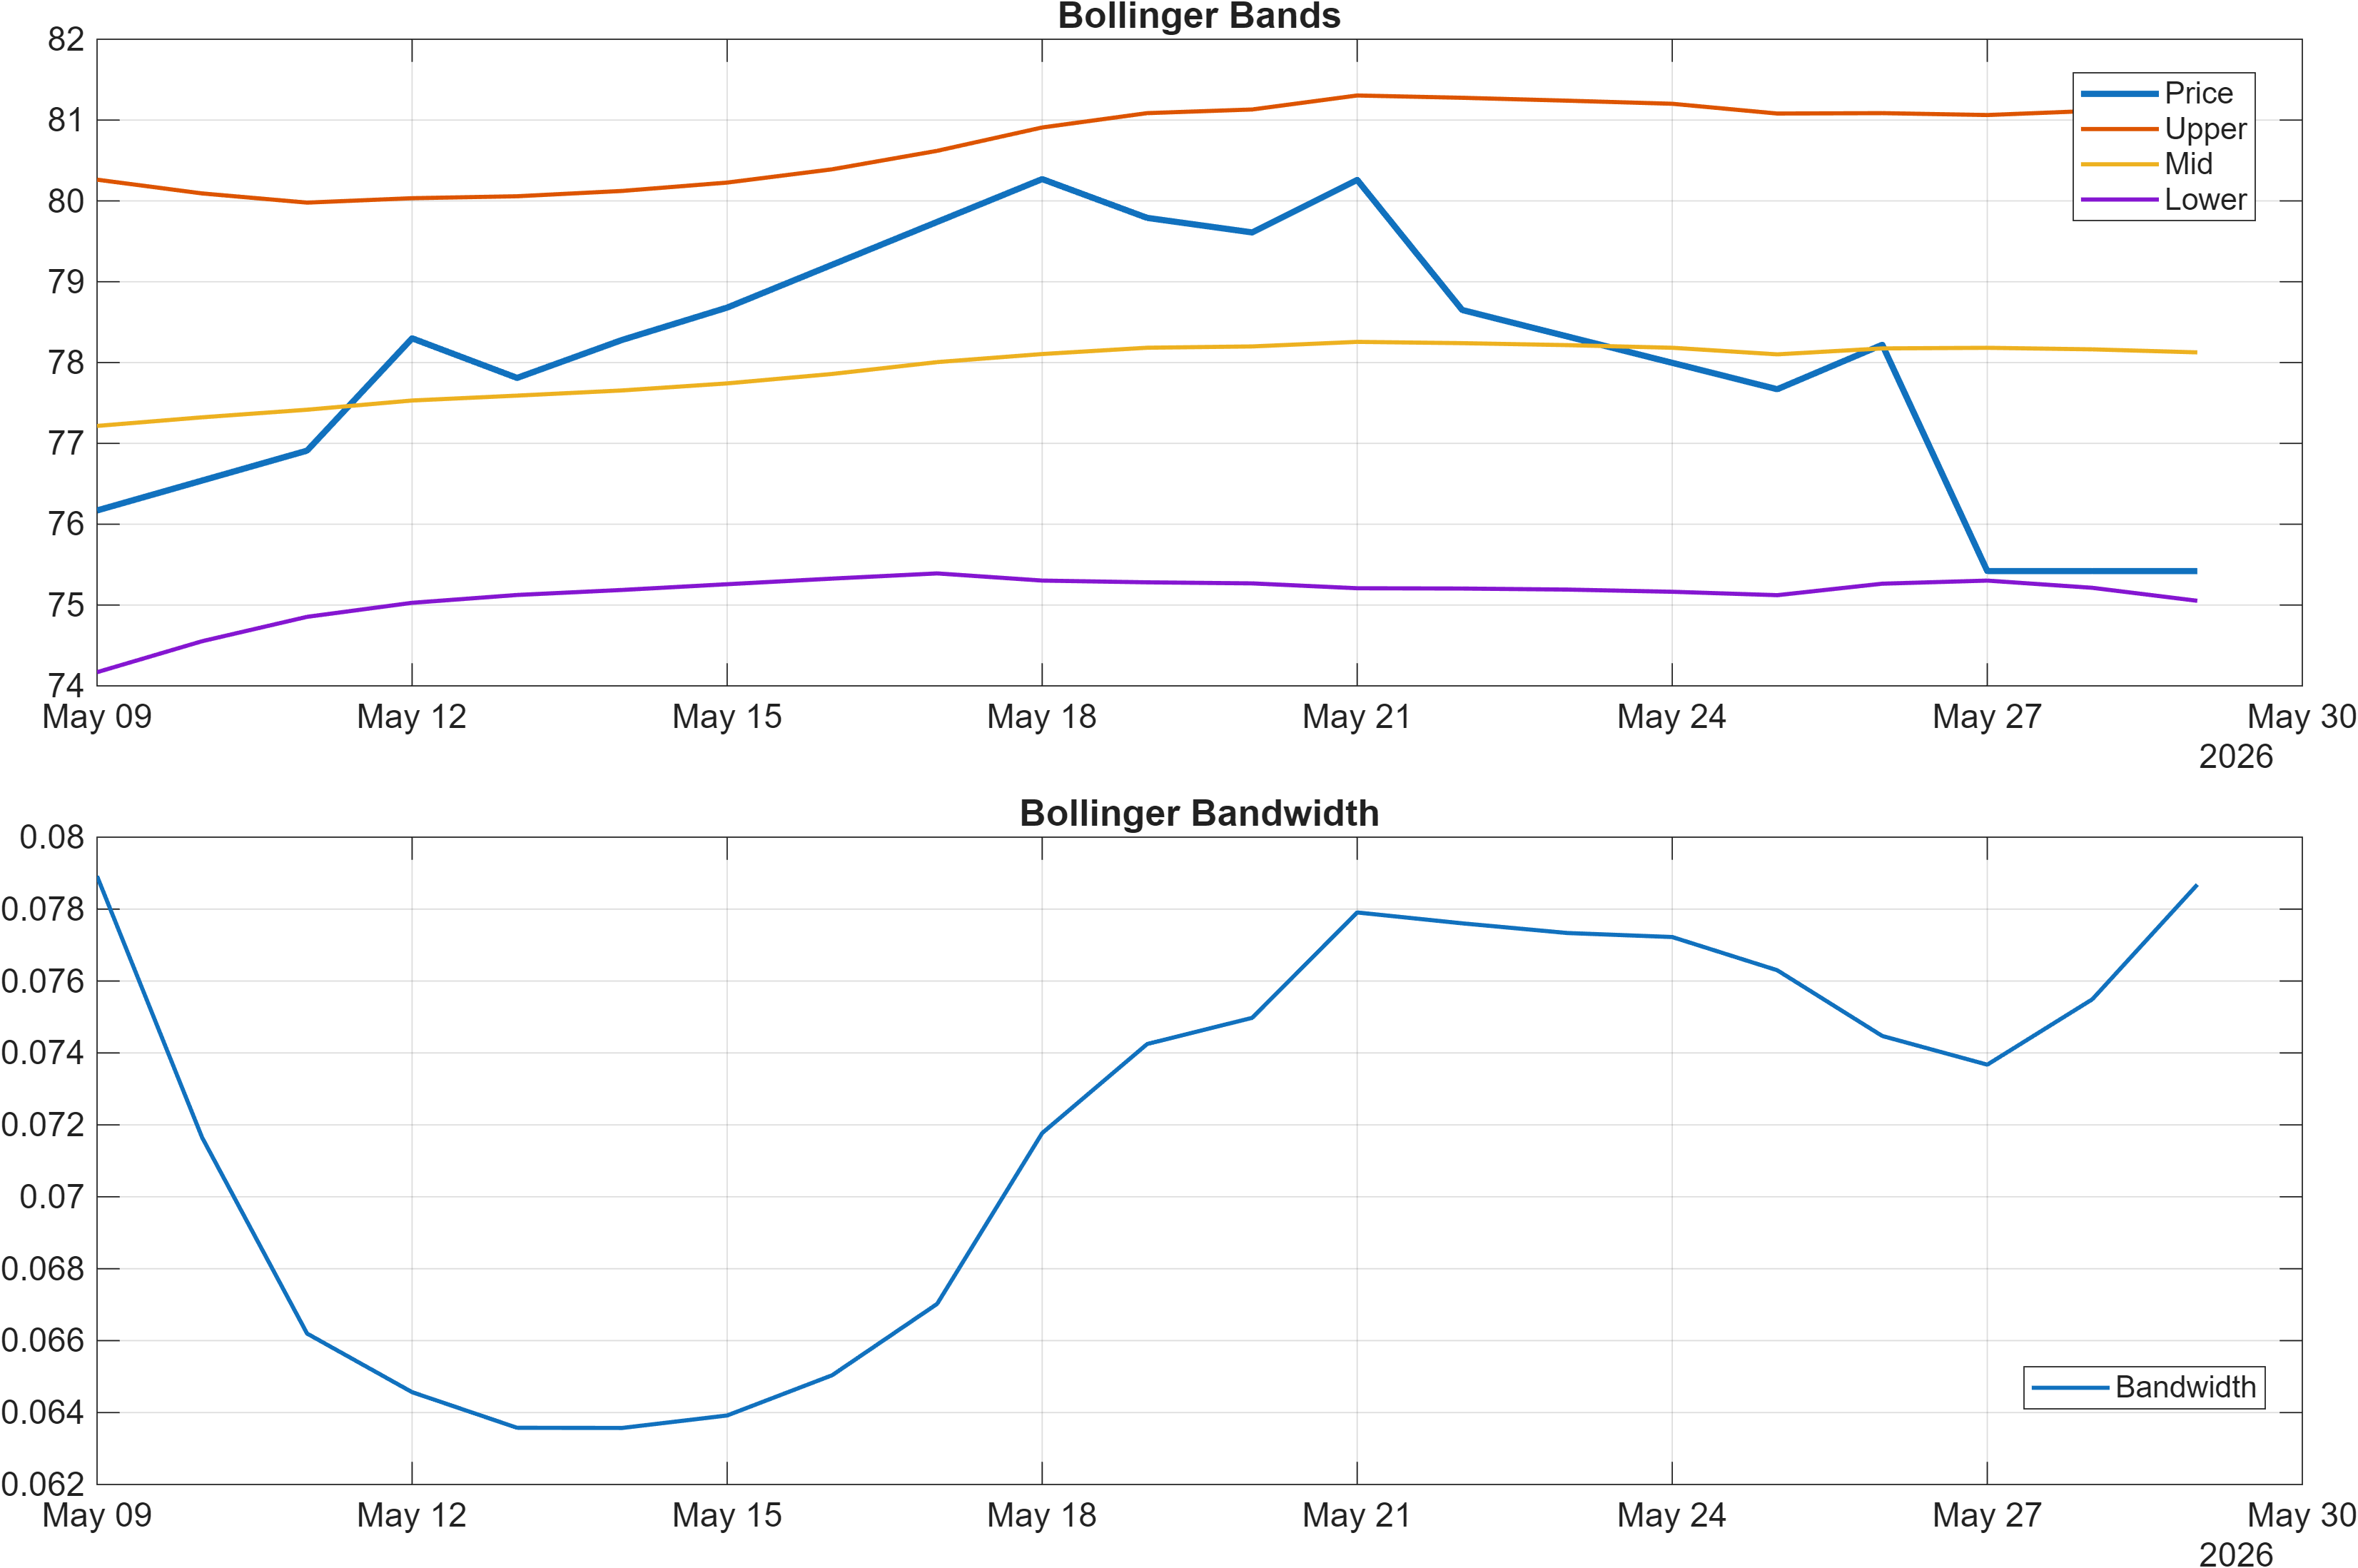
Volatility sits in a comparatively contained regime, with Bollinger Bandwidth at 0.0787. A lower bandwidth environment can amplify the importance of discrete levels—moves beyond well-defined support/resistance may carry more informational value than intraband fluctuations. Put differently: momentum is weak, but volatility is not yet signaling capitulation. That places emphasis on whether momentum improves as price approaches 80.3260, or whether weakness persists into 74.1750.
4) Support / Resistance zones
Support ~ 74.1750 | Resistance ~ 80.3260
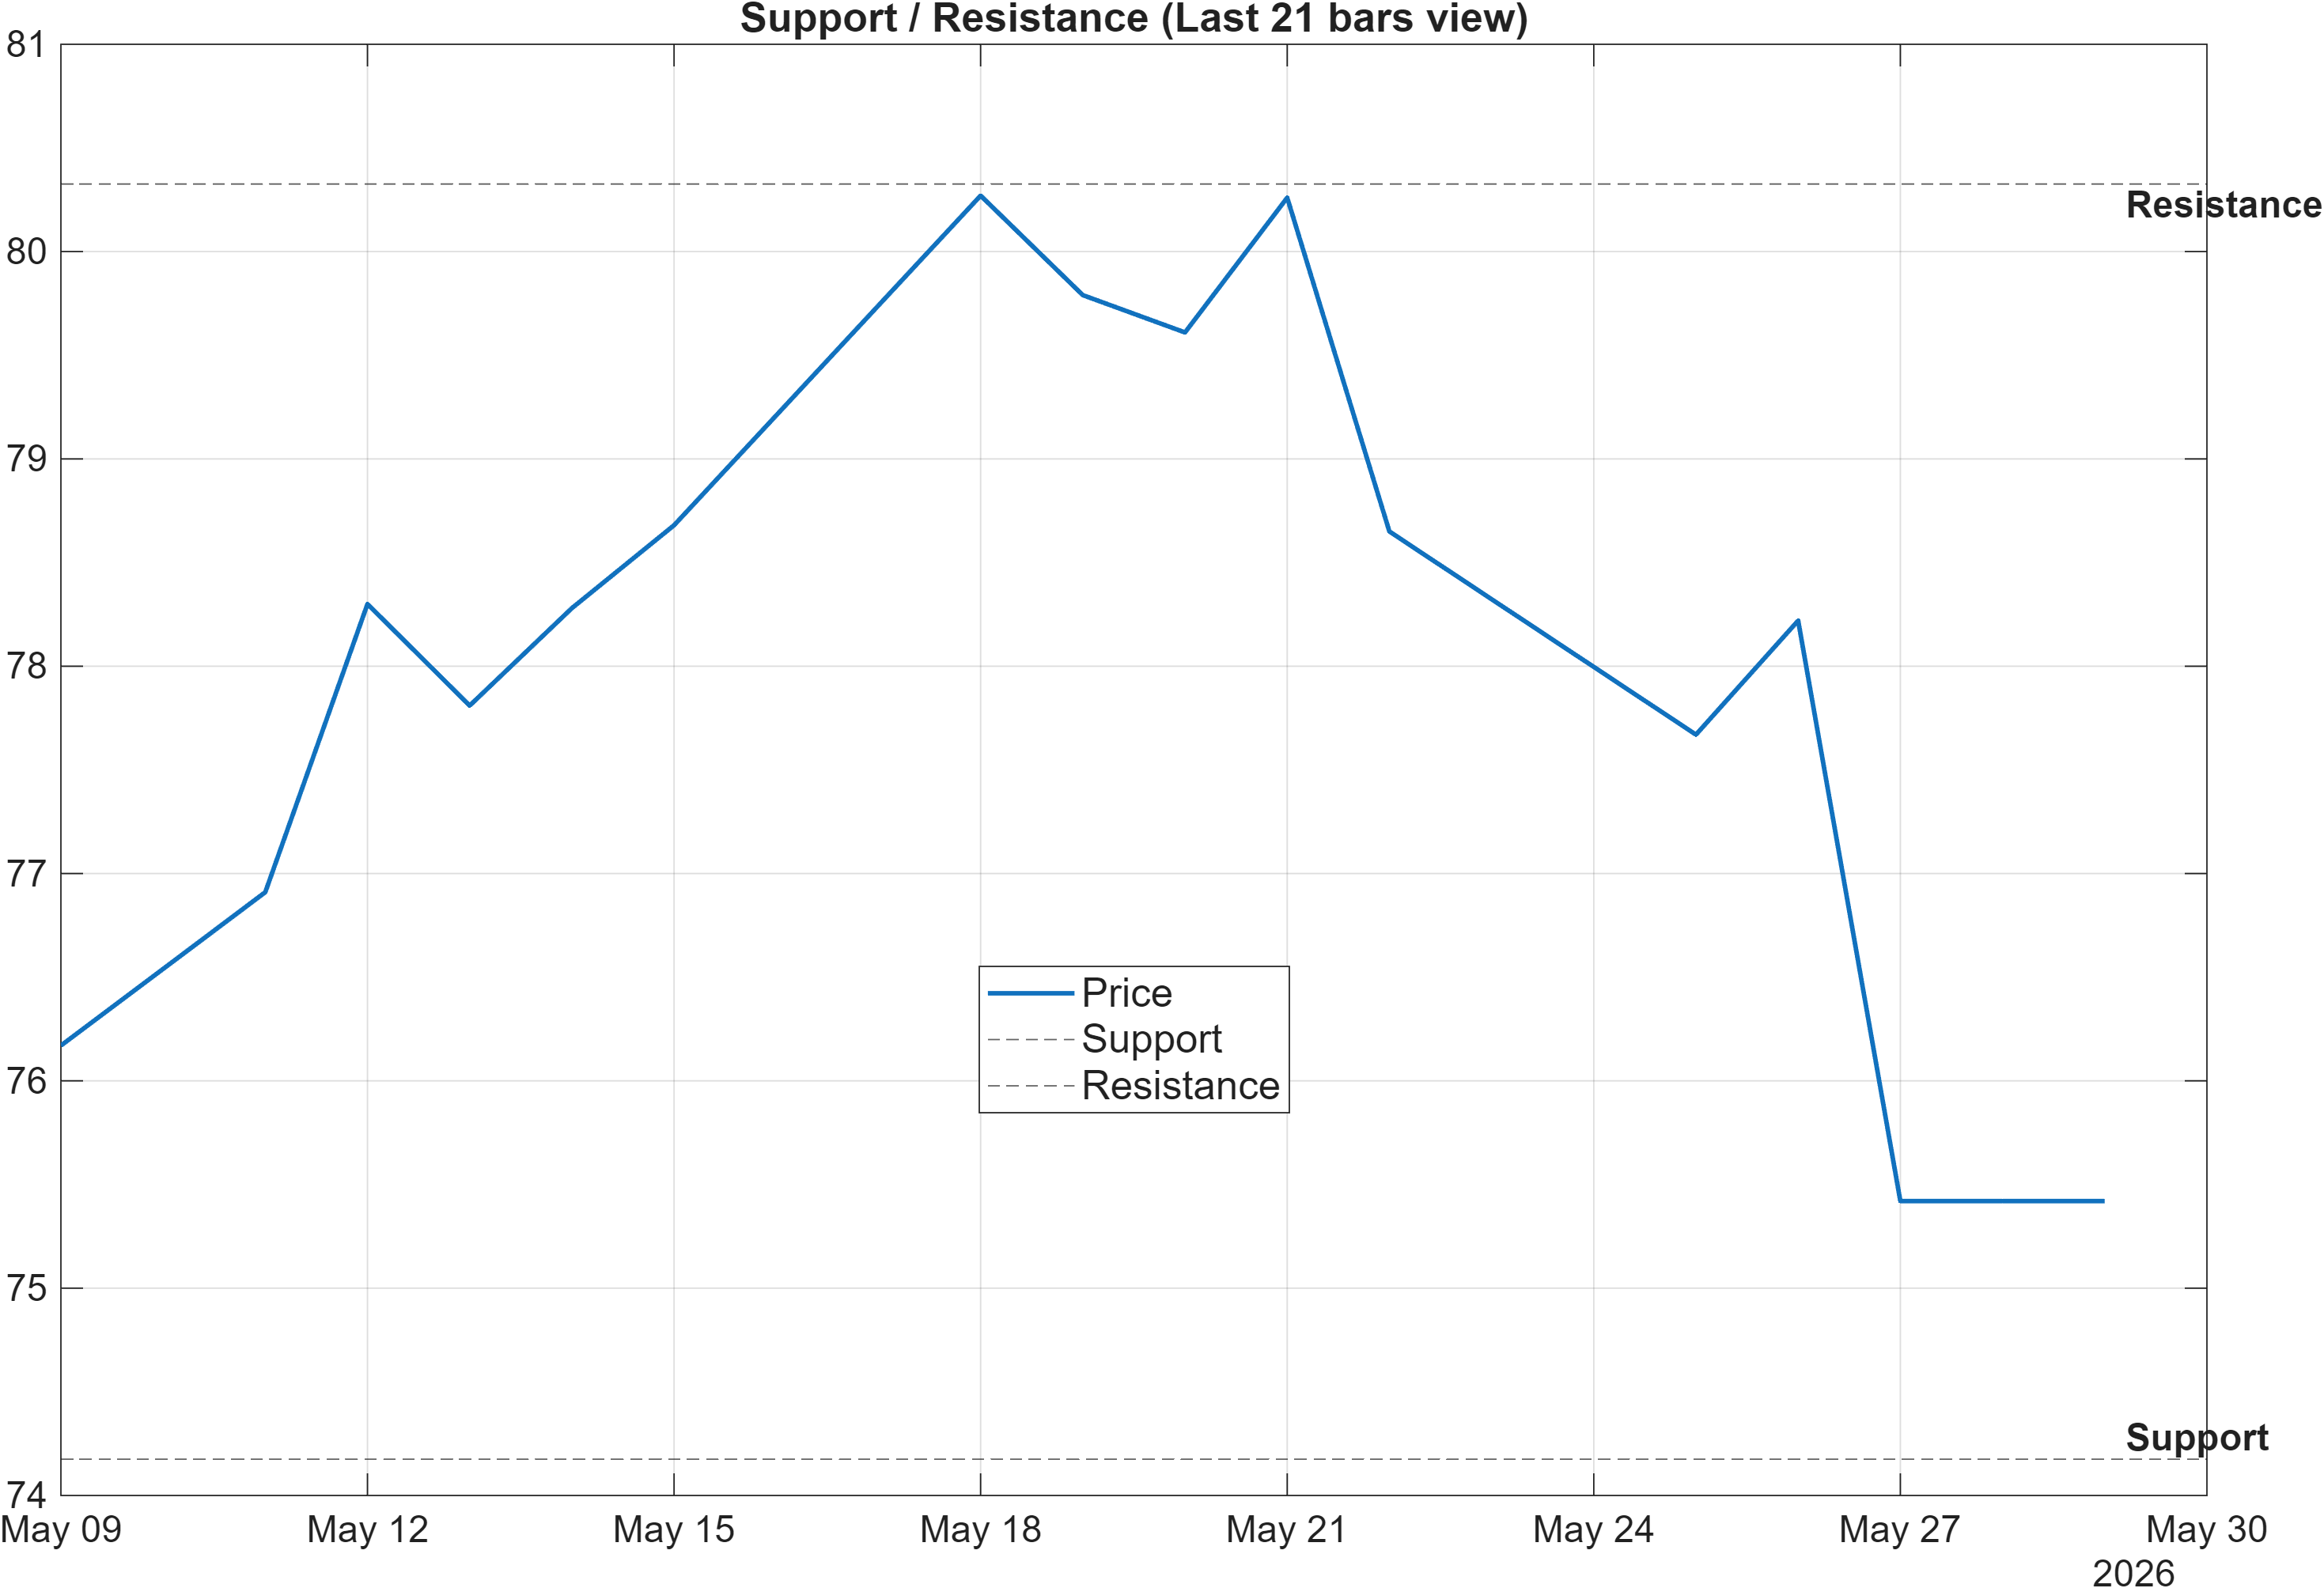
The level map is relatively clean, which is useful when indicators disagree. The 74.1750 support acts as the primary downside decision zone: given the broader technical posture is Bearish (Overall Technical Score -0.521), a close below this level would align price action with the more negative side of the signal stack and would be consistent with the weak Weekly rank (#1224).
Conversely, the 80.3260 resistance is the key area where a bullish case must prove itself. The report’s scenario framing is explicit: break above resistance with volume is required for continuation. That condition also fits the current context of compressed volatility (Bandwidth 0.0787), where breakouts can be more informative than incremental advances.
Importantly, some internal indicators provide a reason to treat support as meaningful rather than arbitrary. In the signal table, MedPx vs Support at 1.295 is labeled Bullish, suggesting price positioning versus the modeled support reference is not yet structurally broken. At the same time, the majority of momentum/volume slopes are Bearish (e.g., OBV slope(10) and PVT slope(10)), which argues that any rebound attempt should be evaluated for participation rather than assumed durable.
With trend resolution unclear, these levels function less as targets and more as validation boundaries: strength needs acceptance above 80.3260; weakness becomes harder to dismiss below 74.1750.
5) Quant Technical Dashboard (18 Signals)
KGNAI AI Technical Analysis Score (Deep Reinforcement Learning): Rank #1291 out of 1412 (Rank 1 represents the strongest technical positioning and a higher probability of favorable price behavior. As ranks increase toward the maximum, the probability of favorable outcomes weakens and bearish positioning becomes more dominant.) | Label: Bearish | Score: -0.829
18-Signal Technical Confluence Score: -0.389 (Bearish)
Overall Technical Score (18-signal confluence + DRL rank blend): -0.521 (Bearish)
Note: The blended score reflects signal strength weighted against broader AI technical ranking, which may temporarily diverge.
Blended technical score breakdown: -0.521 (Bearish | Bull 4 / Bear 11 / Neutral 3)
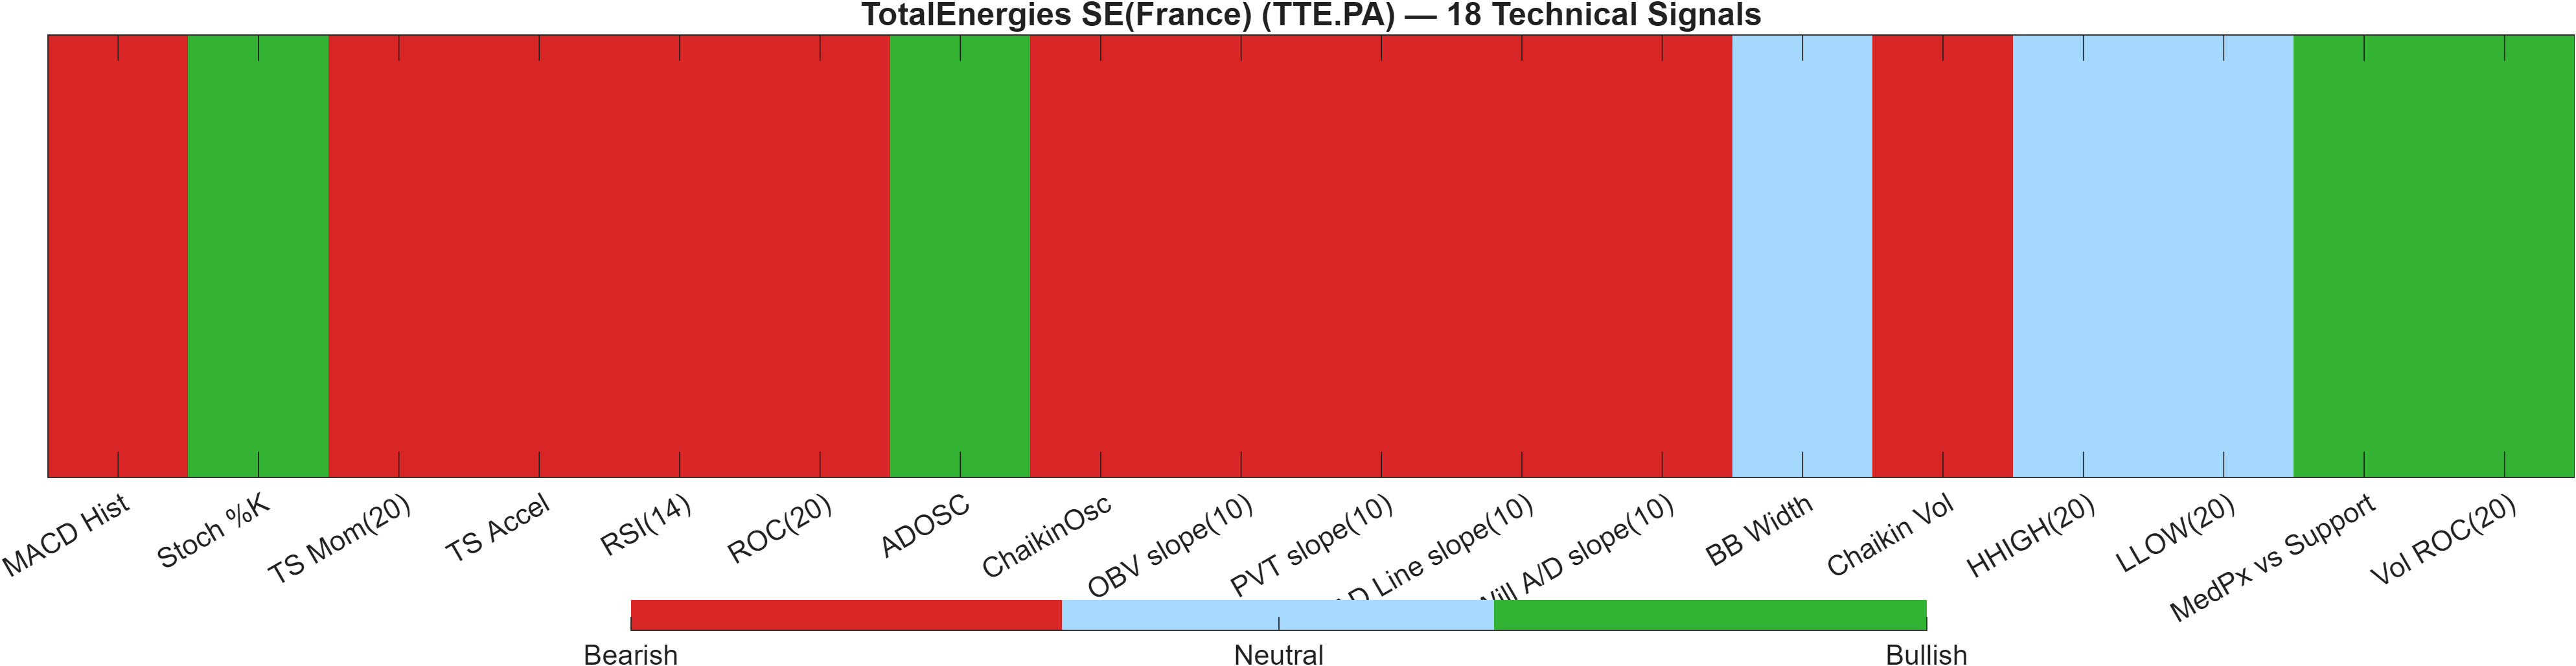
The technical layer is notable for breadth of bearish participation despite the more constructive long-window ranks. The DRL technical rank (#1291/1412) places TTE.PA in the lower decile of the universe on the model’s technical positioning, and the DRL score of -0.829 confirms that the AI technical state is materially negative. That view is consistent with the blended framework: the 18-signal confluence score (-0.389) and Overall Technical Score (-0.521) are both Bearish.
The internal composition also matters. The breakdown (Bull 4 / Bear 11 / Neutral 3) implies the bearish read is not dependent on a single indicator family. Momentum indicators are persistently negative (e.g., MACD histogram -0.4864, TS Mom(20) -1.12, and TS Accel -2.63), which typically makes rallies harder to sustain without a clear catalyst.
At the same time, there are selective offsets that can produce short-lived stabilization. Stoch %K (11.93) and Vol ROC(20) at 28.1 are Bullish, and ADOSC at 42.75 is also Bullish—evidence that some participation/flow measures are not uniformly deteriorating. The presence of neutral volatility structure (BB Width 0.07868) reinforces the idea that the market may be in a compression phase, where the next decisive move is more likely to be validated by level breaks than by incremental indicator improvements.
Signal table (Bull/Bear/Neutral)
| Indicator | Value | Signal |
|---|---|---|
| MACD Hist | -0.4864 | Bearish |
| Stoch %K | 11.93 | Bullish |
| TS Mom(20) | -1.12 | Bearish |
| TS Accel | -2.63 | Bearish |
| RSI(14) | 31.56 | Bearish |
| ROC(20) | -1.463 | Bearish |
| ADOSC | 42.75 | Bullish |
| ChaikinOsc | -2.016e+05 | Bearish |
| OBV slope(10) | -1.648e+07 | Bearish |
| PVT slope(10) | -2.916e+05 | Bearish |
| AD Line slope(10) | -4.641e+06 | Bearish |
| Will A/D slope(10) | -5.937 | Bearish |
| BB Width | 0.07868 | Neutral |
| Chaikin Vol | 13.74 | Bearish |
| HHIGH(20) | 81.25 | Neutral |
| LLOW(20) | 74.63 | Neutral |
| MedPx vs Support | 1.295 | Bullish |
| Vol ROC(20) | 28.1 | Bullish |
Interpretation: Indicator-level signals form the base confluence, which is then adjusted using a separate AI-driven technical ranking model. The final technical score summarizes this combined view.
6) News sentiment + extractive gist
Sentiment score (avg): 0.211 | Positive: 62% | Neutral: 38% | Negative: 0%
KGNAI AI News Sentiment Score (normalized -1 to +1): 1.00 (as of 2026-05-28) | Label: Bullish | Overall news score: 0.93
Positive Developments
Recent coverage across major financial outlets indicates a generally constructive tone around TotalEnergies SE, consistent with the Positive share (62%) and the normalized sentiment reading of 1.00. The news mix highlights analyst actions and favorable framing around the company’s positioning, which can help explain why sentiment remains supportive even while technicals are weak. In the context of the dashboard, this creates a classic sentiment-versus-structure setup: narratives and commentary may reduce downside anxiety, but they do not, by themselves, repair bearish momentum readings such as RSI(14) at 31.56 or the MACD histogram at -0.4864. When sentiment is strong and volatility is relatively contained (Bandwidth 0.0787), markets sometimes stabilize earlier than indicators suggest—yet confirmation typically arrives only if price can reclaim and hold above the defined resistance zone.
Neutral / Mixed Developments
A meaningful portion of the information flow is procedural or disclosure-oriented, which aligns with the Neutral share (38%) in the sentiment breakdown. These items tend to be lower-signal for directional price discovery in the short run, but they can still affect microstructure indirectly by shaping expectations around participation and liquidity. As a result, the market may remain more reactive to technical boundaries than to incremental news flow, particularly while the trend state is unresolved (close vs MA50 Bearish; MA50 vs MA200 Bullish). With ranks split—constructive on Daily (#221) yet weak on Weekly (#1224)—neutral items can function as “background noise” that neither validates a downside continuation nor catalyzes a clean reversal unless accompanied by a decisive move through 80.3260 or below 74.1750.
Negative / Risk Signals
Despite the sentiment model showing 0% negative in the provided distribution, the risk framing is better captured as execution and positioning risk rather than overtly negative headlines. The technical stack remains Bearish (Overall Technical Score -0.521; DRL rank #1291/1412), which can dominate price behavior even when news tone is constructive. Additionally, several participation/accumulation proxies in the signal table are negative (for example, Bearish readings across multiple slope-based volume/flow measures), a configuration that can limit the durability of bounces. The core risk, therefore, is not “bad news” per se; it is that supportive sentiment fails to translate into price acceptance above resistance, leaving the market exposed to a breakdown below 74.1750—a level explicitly tied to deterioration risk in the scenario framework.
- Whether price can break and hold above 80.3260 with confirming participation, versus repeated rejection.
- Whether downside tests of 74.1750 resolve with stabilization (support holds) or deterioration (close below).
- Whether momentum improves from current weak readings (RSI 31.56, MACD hist -0.4864) as volatility remains contained (Bandwidth 0.0787).
Sources referenced: Reuters, Bloomberg, Yahoo Finance, MarketWatch, Investing.com
7) Sources
Not available in the provided data.
You may also like: How KGNAI AI ranks instruments across global markets
Disclaimer: KGNAI provides AI-generated analytics and educational market commentary only. This is not financial advice. Markets involve risk. Always do your own research.