
ITM Power(UK) (ITM.LSE) — Quantitative Rank & Technical Alignment Review (25-Feb-2026), Bearish Short/Mid with Neutral Long Bias
ITM Power(UK) (ITM.LSE) currently screens weak on KGNAI’s cross-universe ranking framework in the short and medium horizons, while longer-horizon signals remain more balanced. Within a 1425-instrument European universe, the Daily (#1391) and Weekly (#1383) ranks sit in the lowest tail of the distribution, consistent with fragile near-term positioning. Trend structure also leans defensive: the chart read flags Close vs MA50 = Bearish and MA50 vs MA200 = Bearish, implying downside pressure within the prevailing moving-average regime. Momentum is not decisively capitulative (RSI bias is Neutral with RSI(14) 49.73), but the MACD histogram at -0.1206 keeps momentum skewed negative. Volatility conditions look contained rather than expanding, with Bollinger bandwidth at 0.1413, putting more emphasis on key decision zones at 59.1833 (support) and 70.1000 (resistance). News sentiment is statistically positive in the dataset (score 1.00), though instrument-specific matches were not available in the provided data.
- Rank stance: Short-term Bearish, mid-term Bearish, long-term Neutral (universe size: 1425).
- Technical confluence label: Neutral (18-signal confluence -0.056; blended technical score -0.271).
- Key levels: Support ~ 59.1833 | Resistance ~ 70.1000.
- News sentiment bias: Statistically Bullish (1.00 normalized), but instrument-specific news matches were not available in the provided data.
- Confirmation / invalidation: A sustained hold above 70.1000 with volume supports continuation; a close below 59.1833 elevates deterioration risk.
KGNAI evaluates assets using large cross-sectional datasets built from millions of structured data points. Inputs incorporate fundamental metrics, technical structures, and systematically processed news sentiment. Statistical models, machine learning, and AI frameworks are used to assess relative positioning, signal alignment, and probabilistic behavior across broad universes.
- Ranks are comparative across the tracked universe, not absolute price targets.
- Confluence reflects alignment among independent signal groups.
- Support/resistance levels are probabilistic decision zones, not guarantees.
- Sentiment provides contextual bias within the broader analytical framework.
1) KGNAI AI Analysis
Region: EUROPE
Total universe size: 1425 ranked instruments
- Daily rank: #1391 out of 1425 — Bearish
- Weekly rank: #1383 out of 1425 — Bearish
- Monthly rank: #1123 out of 1425 — Neutral
- 3-Monthly rank: #1297 out of 1425 — Bearish
- 6-Monthly rank: #368 out of 1425 — Neutral
- Yearly rank: #968 out of 1425 — Neutral
The cross-horizon profile is asymmetric: short-horizon ranks are clustered near the weakest end of the universe (Daily #1391, Weekly #1383), while longer horizons loosen toward neutrality (6-Month #368, Yearly #968). That split is often associated with a market that is struggling to sustain near-term bid strength even if the longer window is not uniformly degraded.
The Monthly stance remains Neutral at #1123, but the 3-Month rank (#1297) reverts to Bearish, highlighting that mid-cycle conditions have not stabilized. Practically, this means the security is not merely “weak today”; it is also not screening well over a broader intermediate window.
Importantly, the long-horizon labels being Neutral does not offset the short-term tail positioning; it instead suggests regime ambiguity: pressure is concentrated in the near-term distribution while the longer-term distribution has not fully capitulated. The term view embedded in the dataset aligns with this: Short-term Bearish, Mid-term Bearish, Long-term Neutral.
KGNAI ranks each instrument across large universes using multiple proprietary AI tests and statistical models (millions of data points). Lower ranks generally indicate stronger probability of favorable performance behavior, while higher ranks indicate weaker probability and more bearish positioning.
Term view: Short-term: Bearish. Mid-term: Bearish. Long-term: Neutral.
Want the full universe and complete rank tables? Unlock full access on KGNAI: https://www.kgnai.com/pricing
2) Price & trend overview
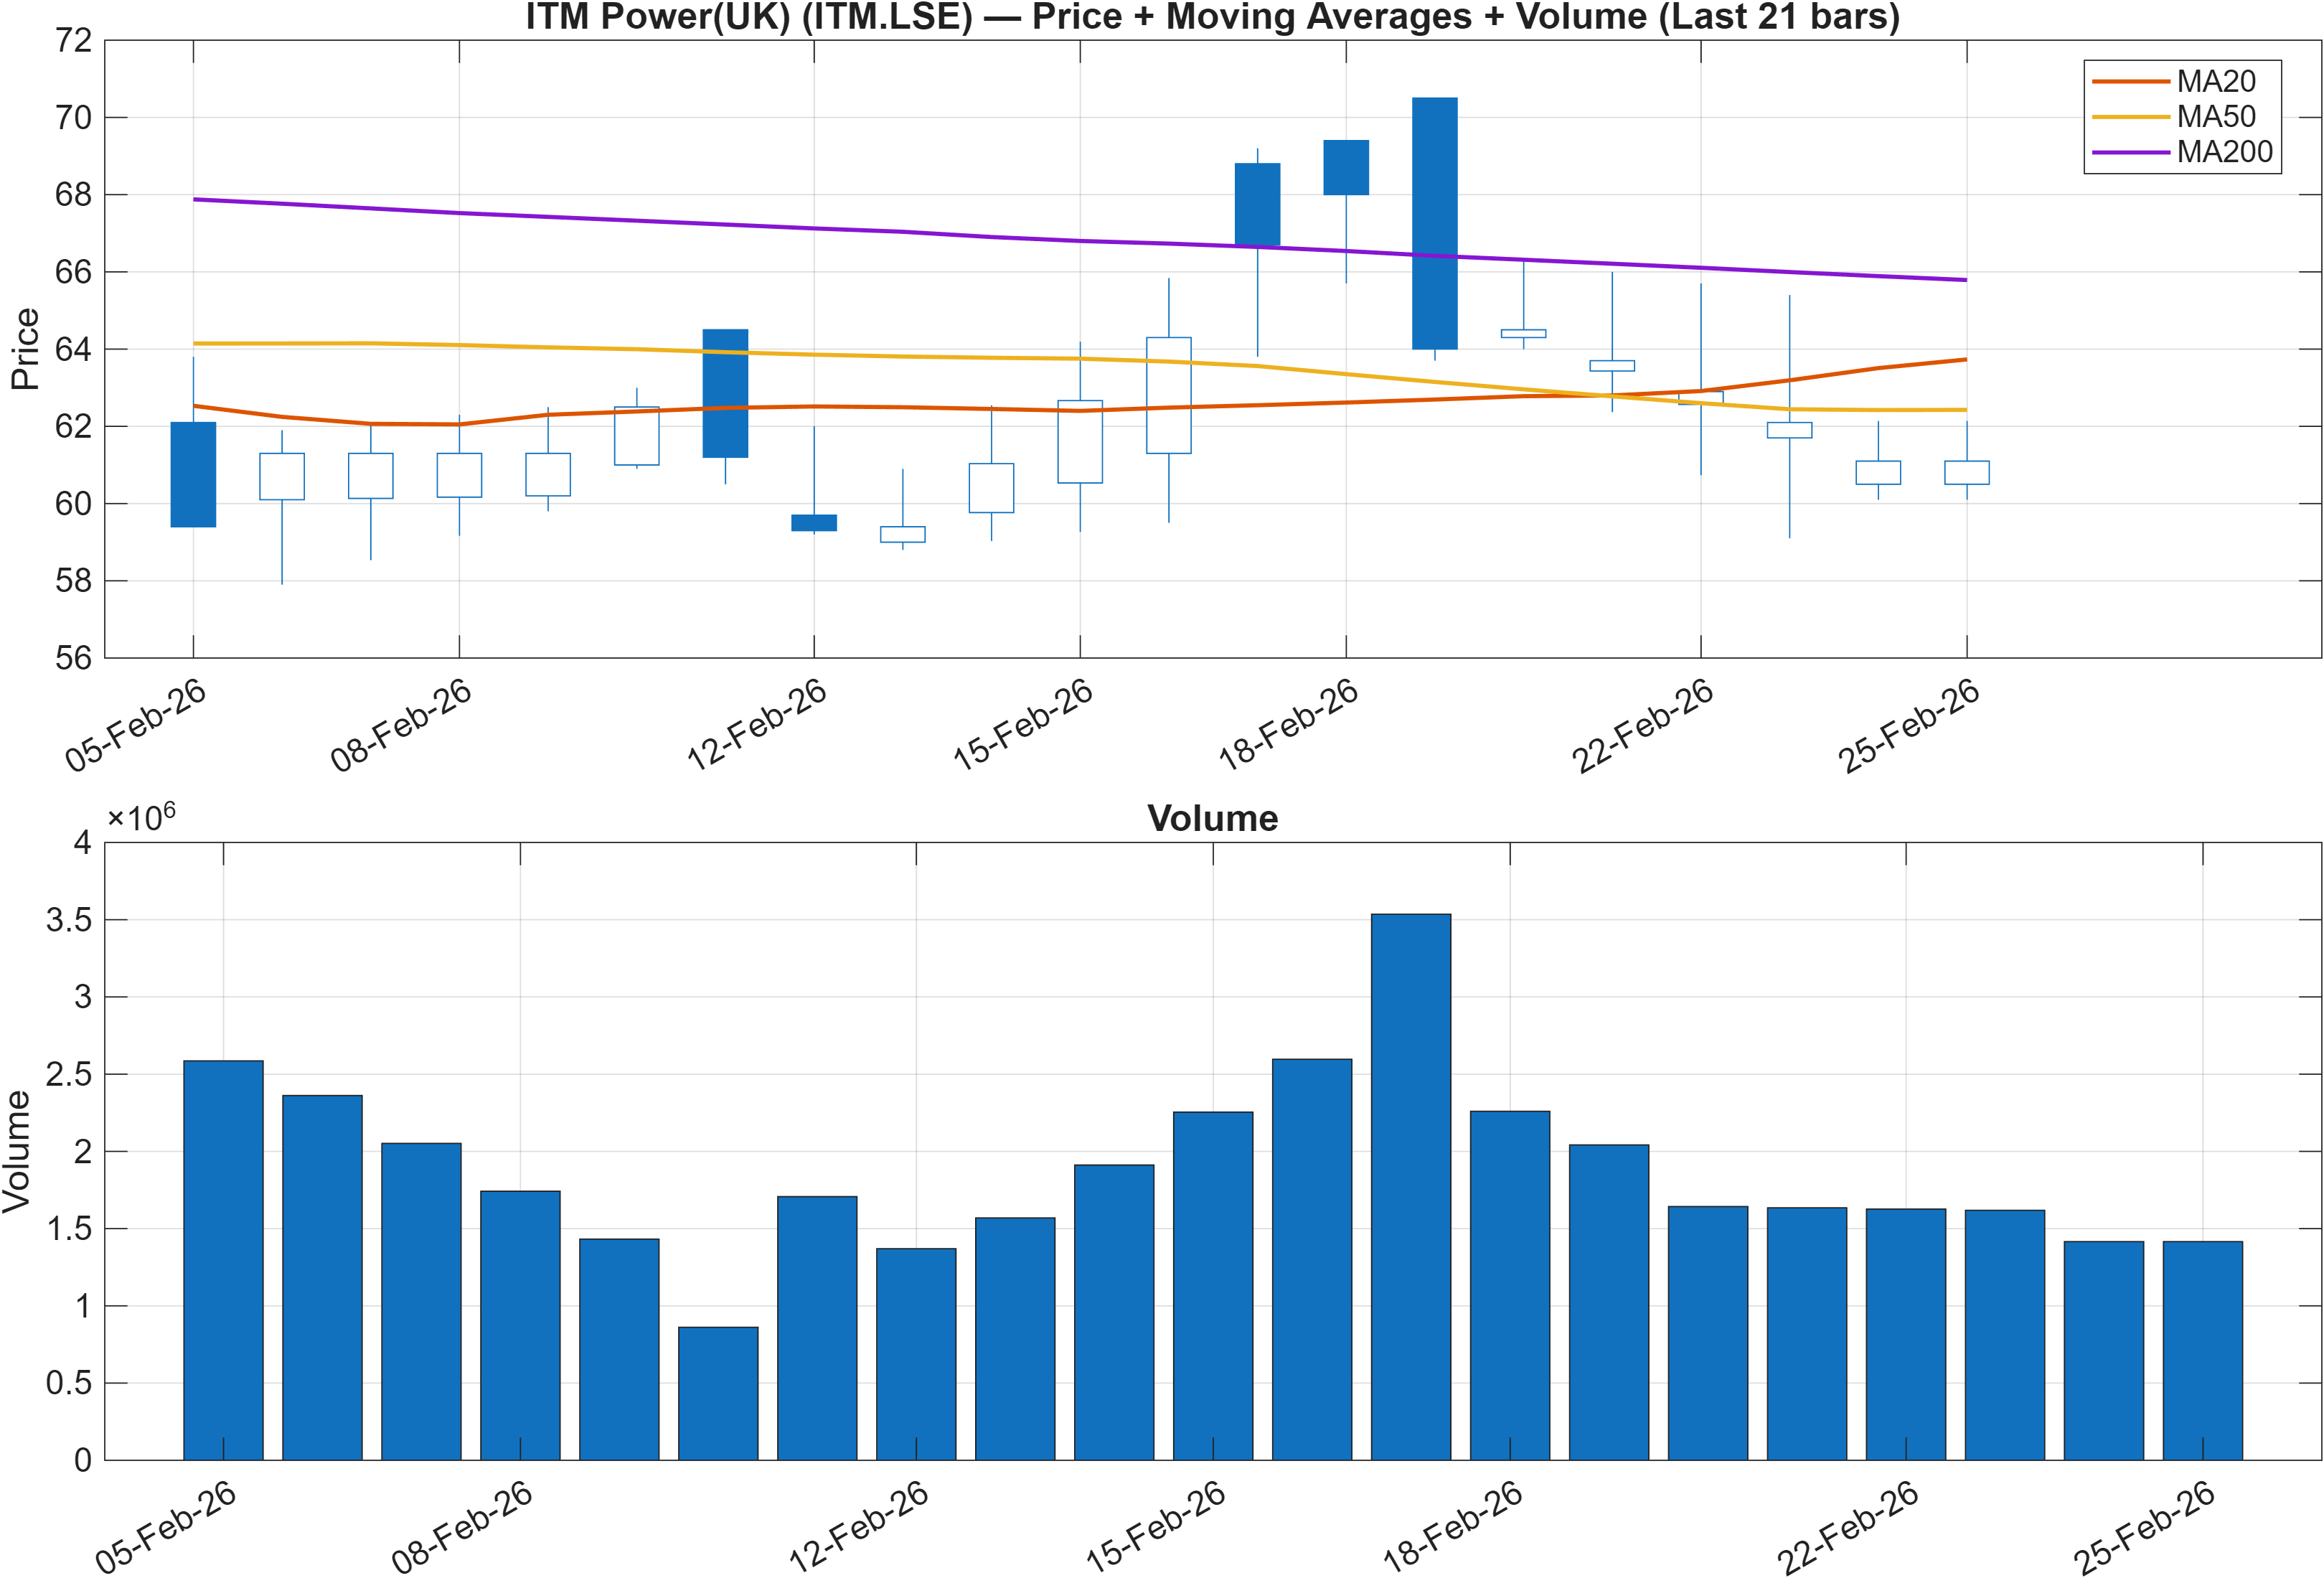
Interpretation: Close vs MA50 = Bearish, MA50 vs MA200 = Bearish.
Regime read: trend persistence vs potential transition
The moving-average stack is consistently negative: the close is below the MA50 and the MA50 is below the MA200, a combination typically associated with a bearish trend regime rather than a short-lived pullback. This structure often requires either a sustained base-building phase or a decisive upside impulse to change character; absent that, rebounds can be more vulnerable to supply.
The rank distribution supports this “pressure-first” interpretation. With the Daily rank at #1391 and Weekly at #1383, the instrument is screening in the weakest slice of its universe precisely while the trend regime is bearish. When price structure and cross-sectional rank are aligned on the downside, false breakouts tend to be more common than clean follow-through—especially if volume fails to confirm.
At the same time, the longer-horizon rank is not uniformly bearish (6-Month #368, labeled Neutral). That divergence can occur when a longer window includes prior recovery phases or when the security is oscillating rather than trending smoothly. In those cases, the key issue is location: whether price can reclaim trend-defining references (e.g., the MA50) before testing the lower decision zones.
From a structure standpoint, the next read-through is less about forecasting and more about observing sequencing: can price regain strength relative to the MA50 while the broader regime remains MA50<MA200, or does the bearish regime continue to dominate and pull price toward support? The support/resistance framework in Section 4 provides the actionable map for that sequencing.
3) Momentum & volatility dashboard
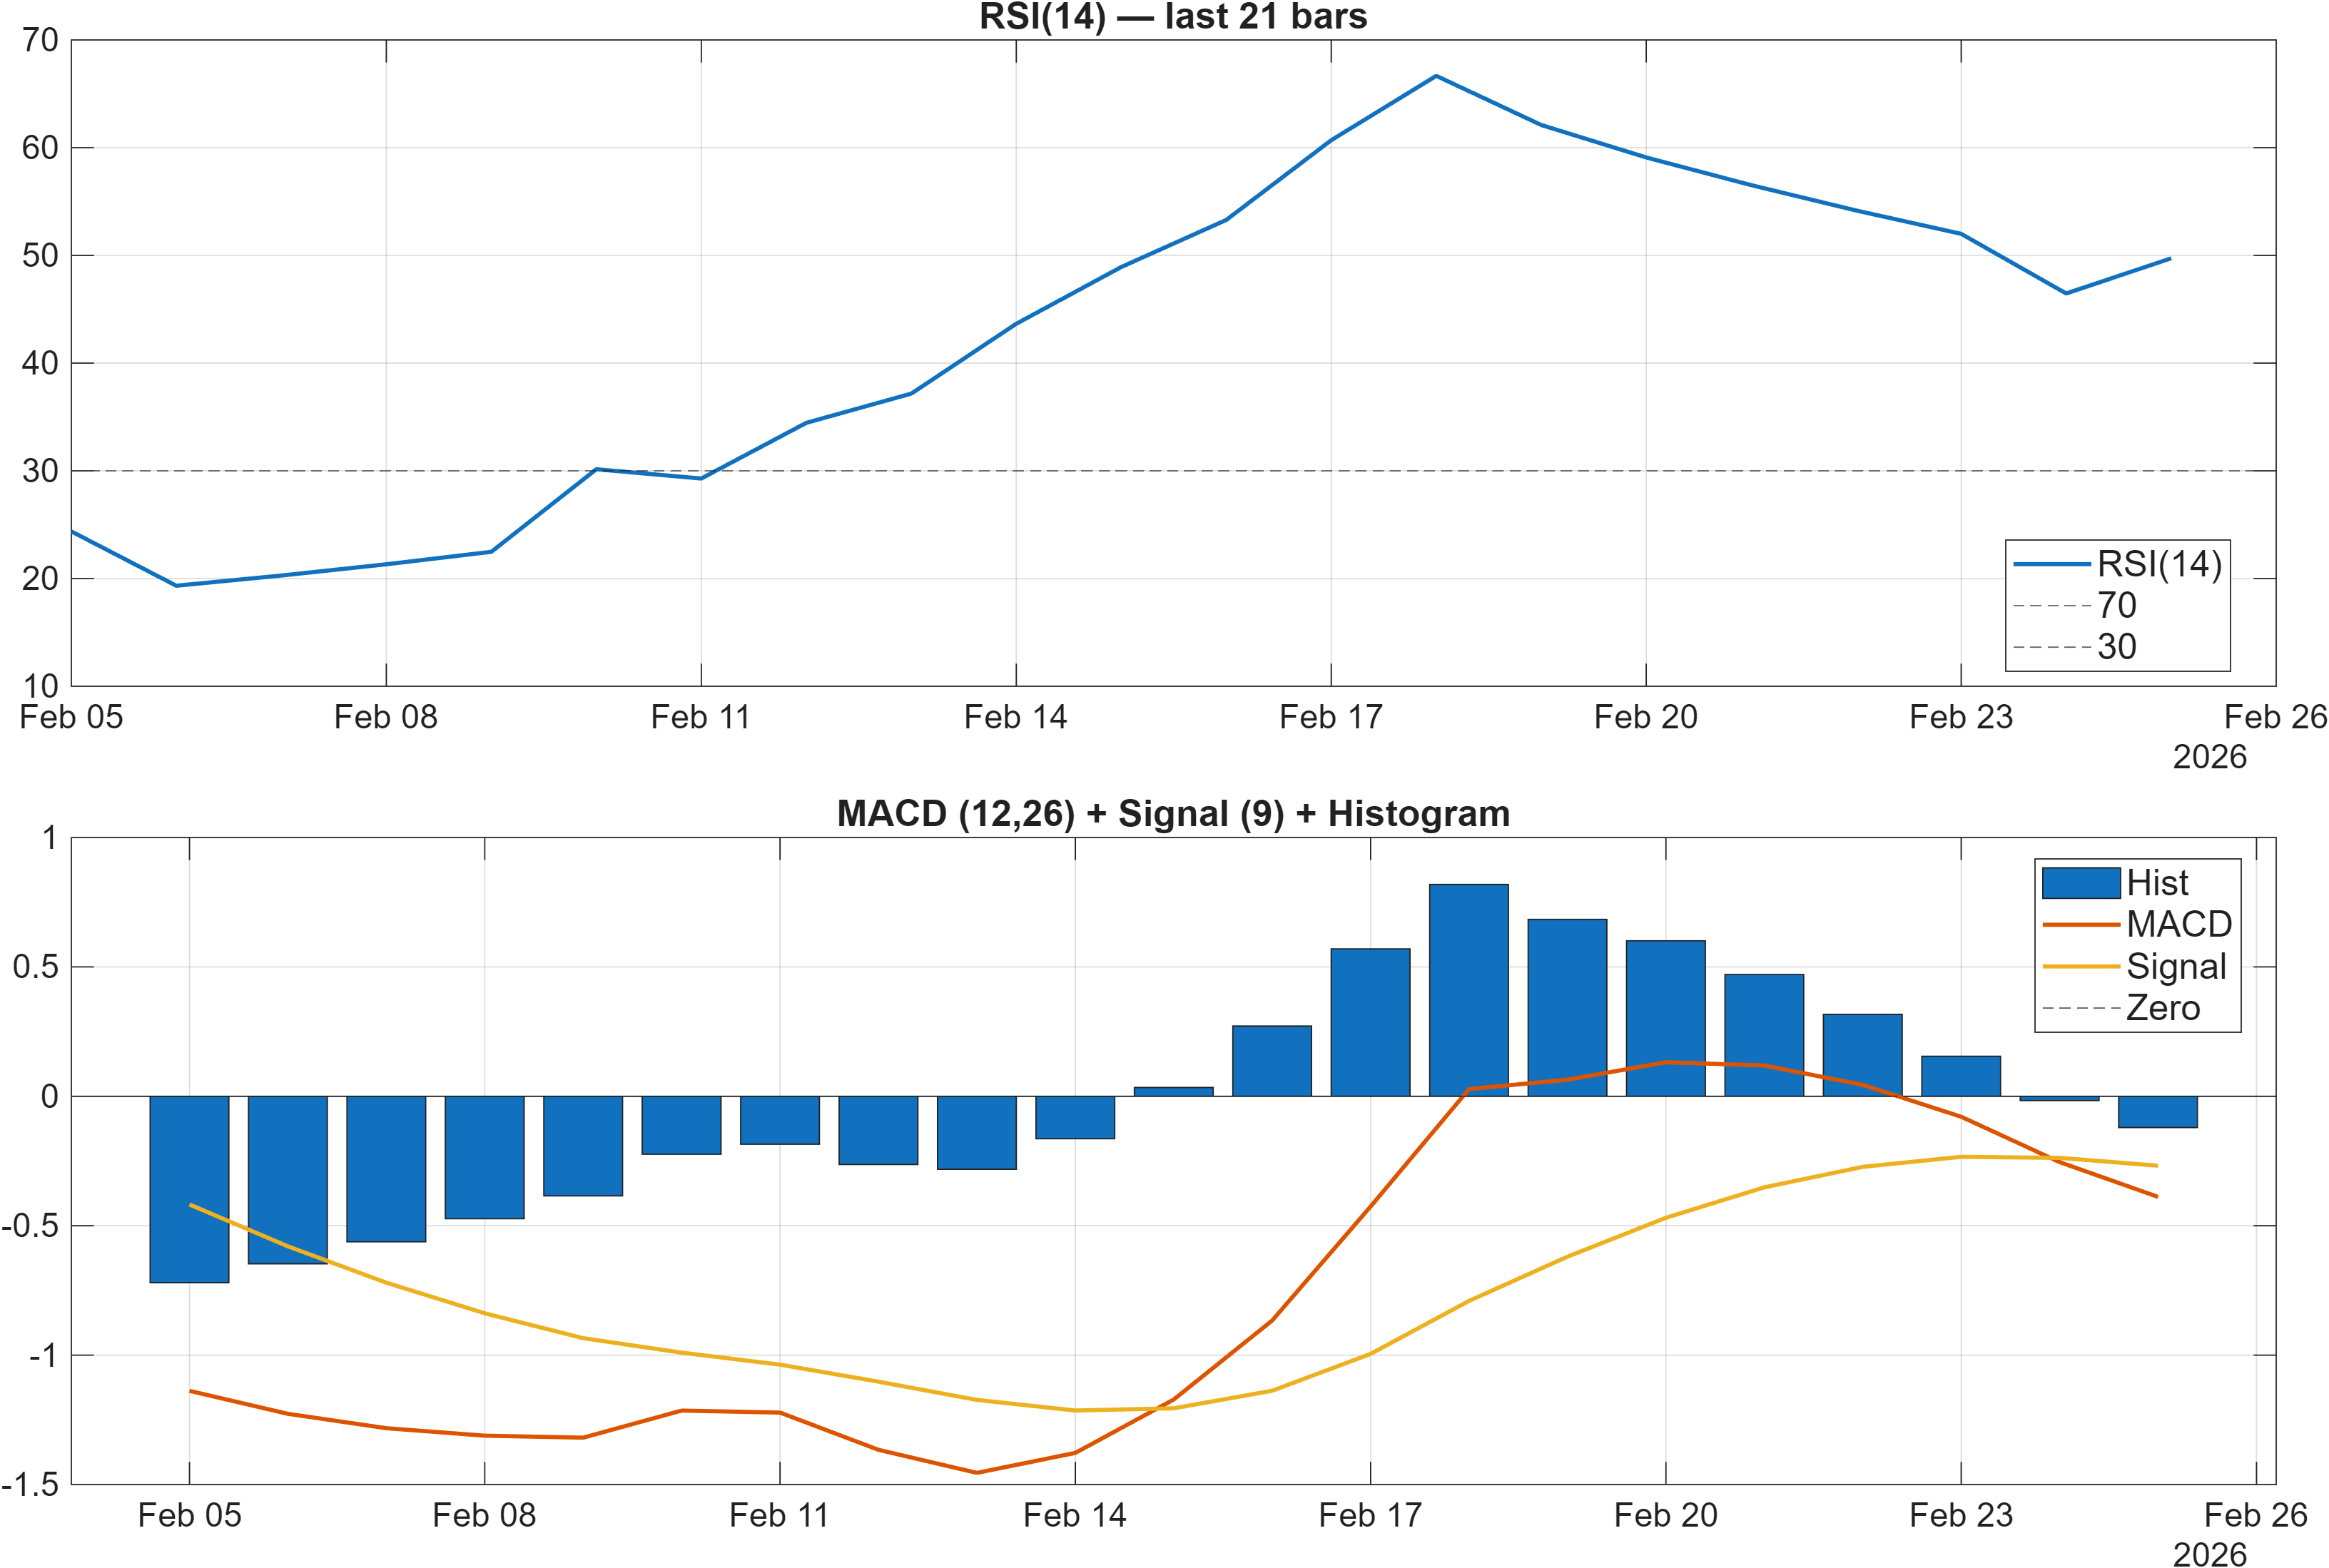
Interpretation: RSI bias = Neutral, MACD hist = -0.1206.
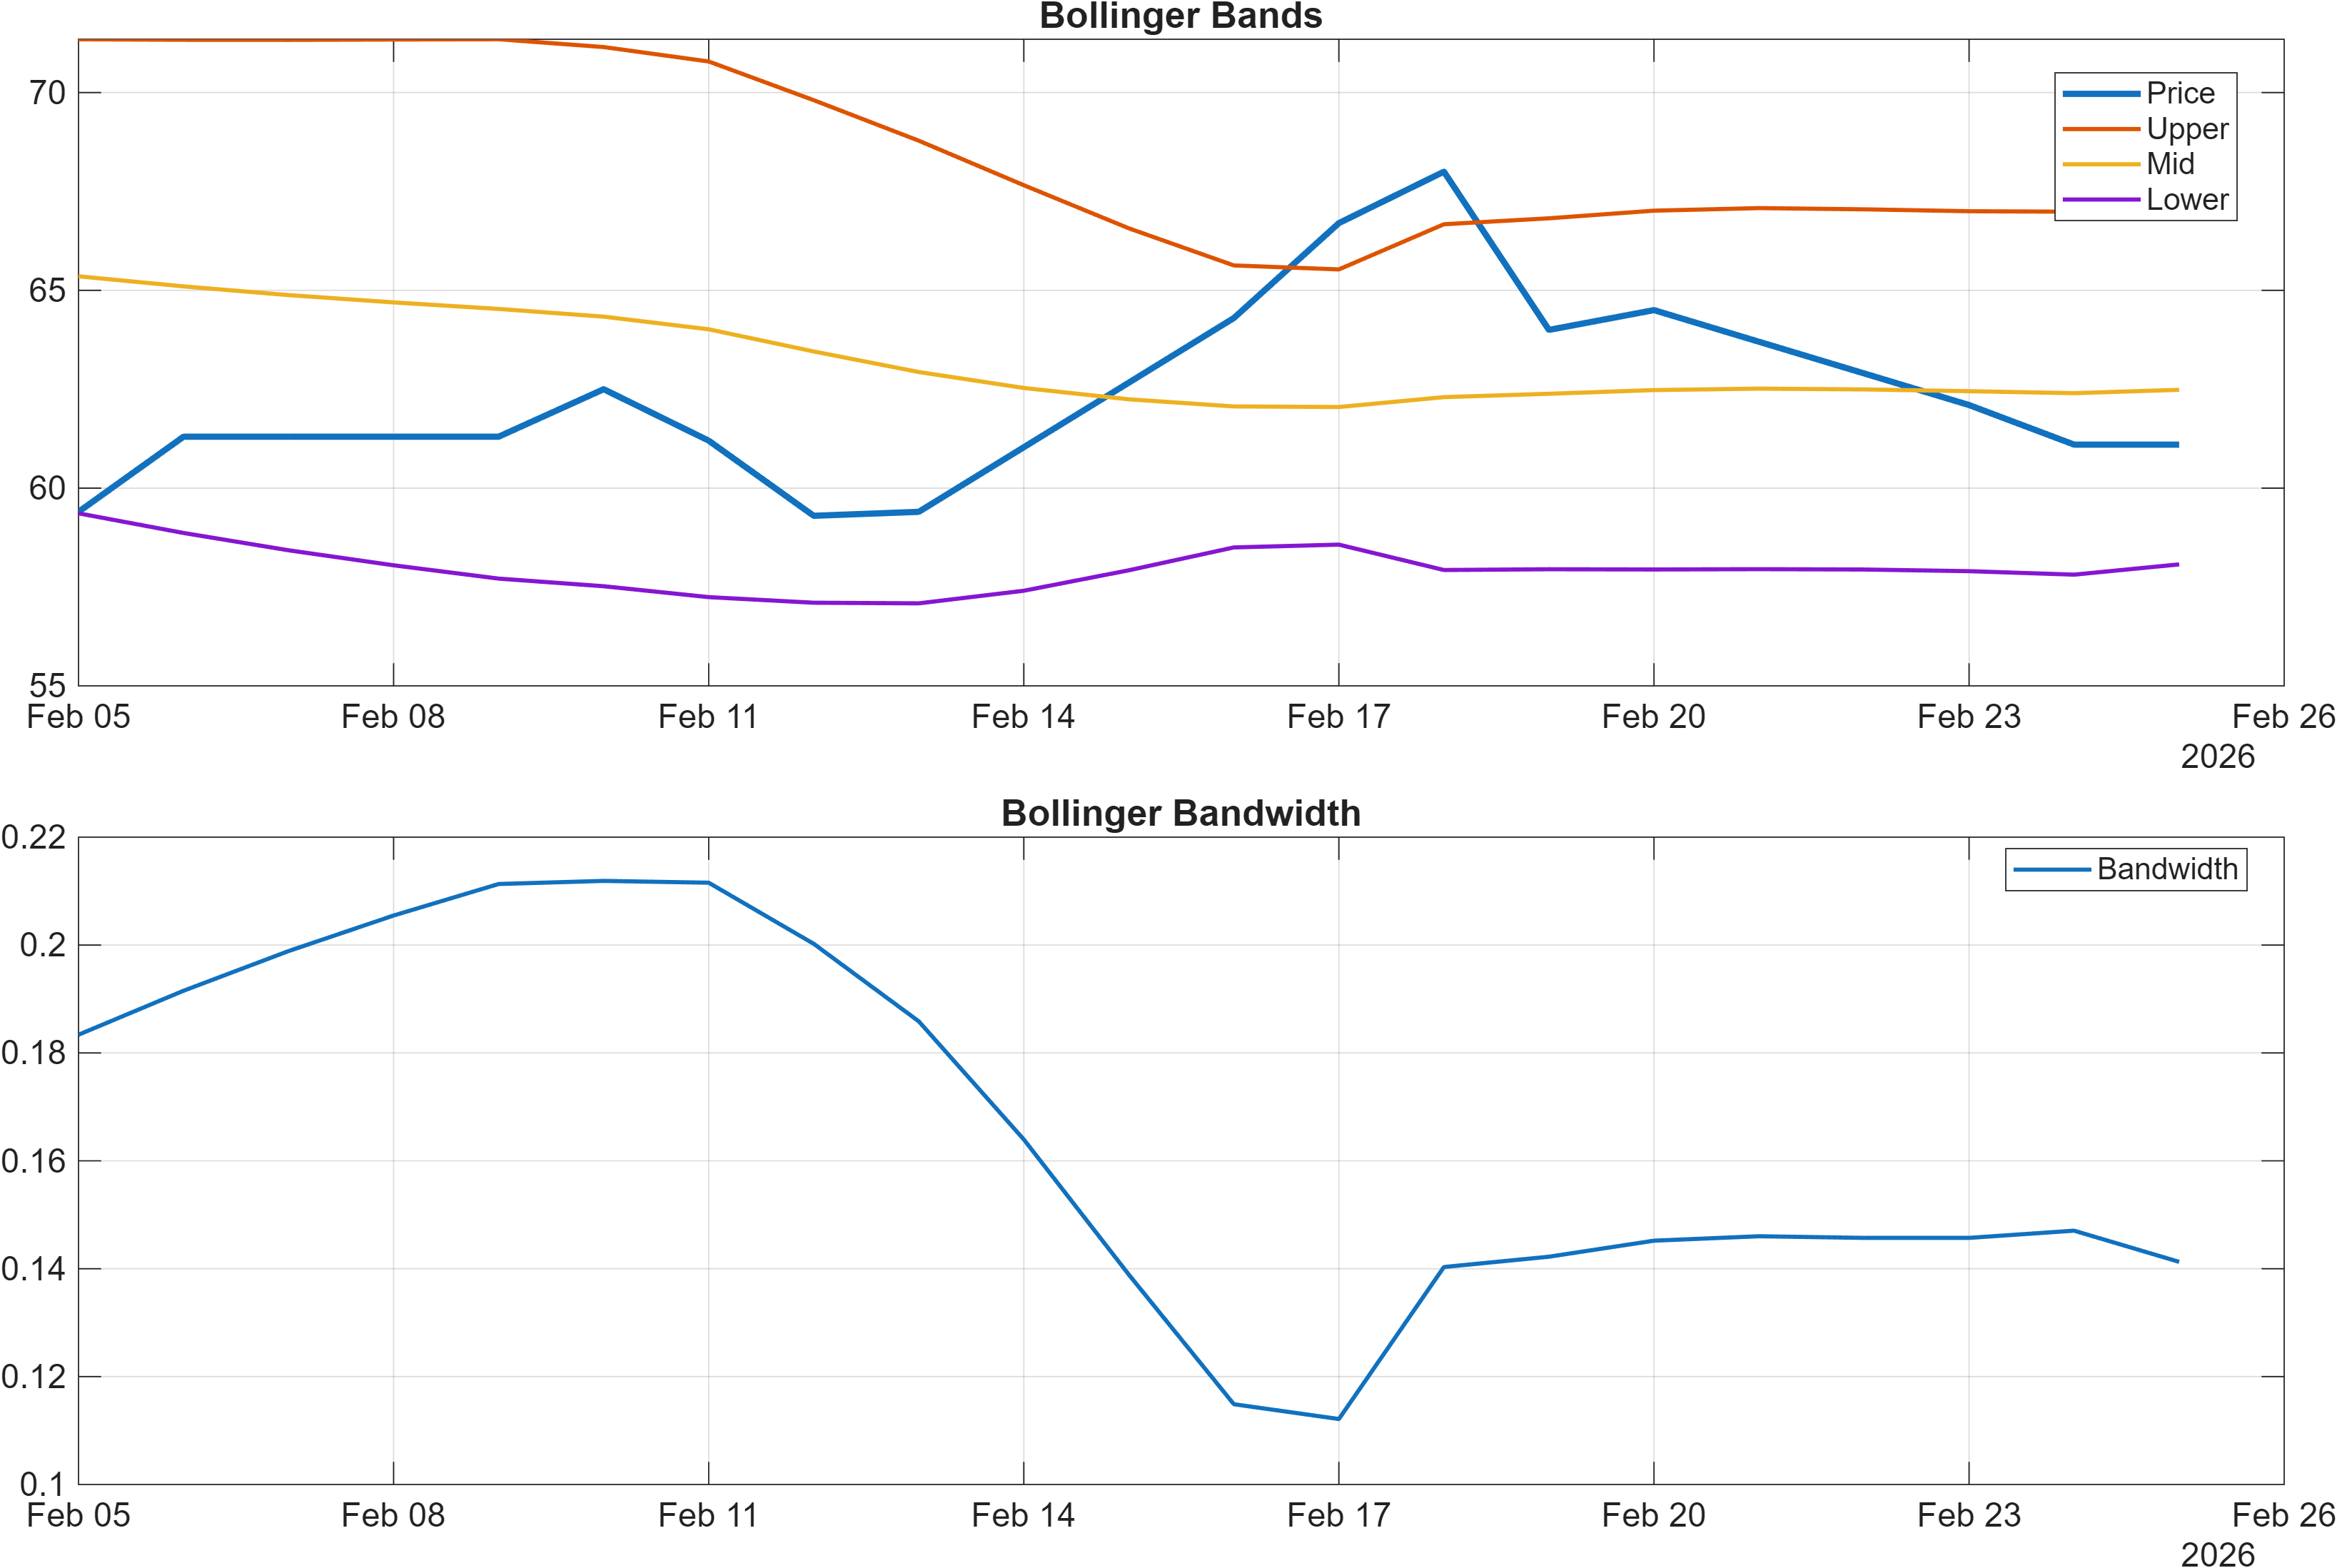
Interpretation: Bandwidth (volatility regime) latest = 0.1413.
Momentum divergence: neutral oscillator vs bearish impulse
Momentum signals are not fully synchronized. RSI sits near the midpoint (RSI(14) 49.73, bias Neutral), which typically suggests neither persistent overbought pressure nor deep oversold stress. In isolation, that can be consistent with consolidation, range trade, or early stabilization.
By contrast, the MACD histogram at -0.1206 indicates that negative impulse still dominates. When RSI is neutral while MACD remains negative, the market can be “resting” within a bearish regime rather than reversing; it often takes a shift in impulse (MACD improvement) to validate RSI stability as constructive rather than merely non-oversold.
Volatility regime: compression vs expansion risk
Volatility is not signaling a broad expansion at present: Bollinger bandwidth is 0.1413, and the BB Width signal in the technical table is marked Neutral. Lower/contained bandwidth frequently increases sensitivity to nearby levels; directional breaks can become more impactful because stops and triggers concentrate around well-defined zones.
This matters given the rank backdrop: the instrument’s short-horizon ranks (Daily #1391, Weekly #1383) are already weak, so a volatility expansion that occurs downward would align with existing cross-sectional pressure. Conversely, if volatility expands upward and momentum improves, it would represent a more meaningful deviation from the current regime.
Net: the dashboard reads as bearish impulse with neutral oscillation under a relatively contained volatility envelope—conditions that typically place additional weight on support/resistance outcomes rather than on oscillator levels alone.
4) Support / Resistance zones
Support ~ 59.1833 | Resistance ~ 70.1000
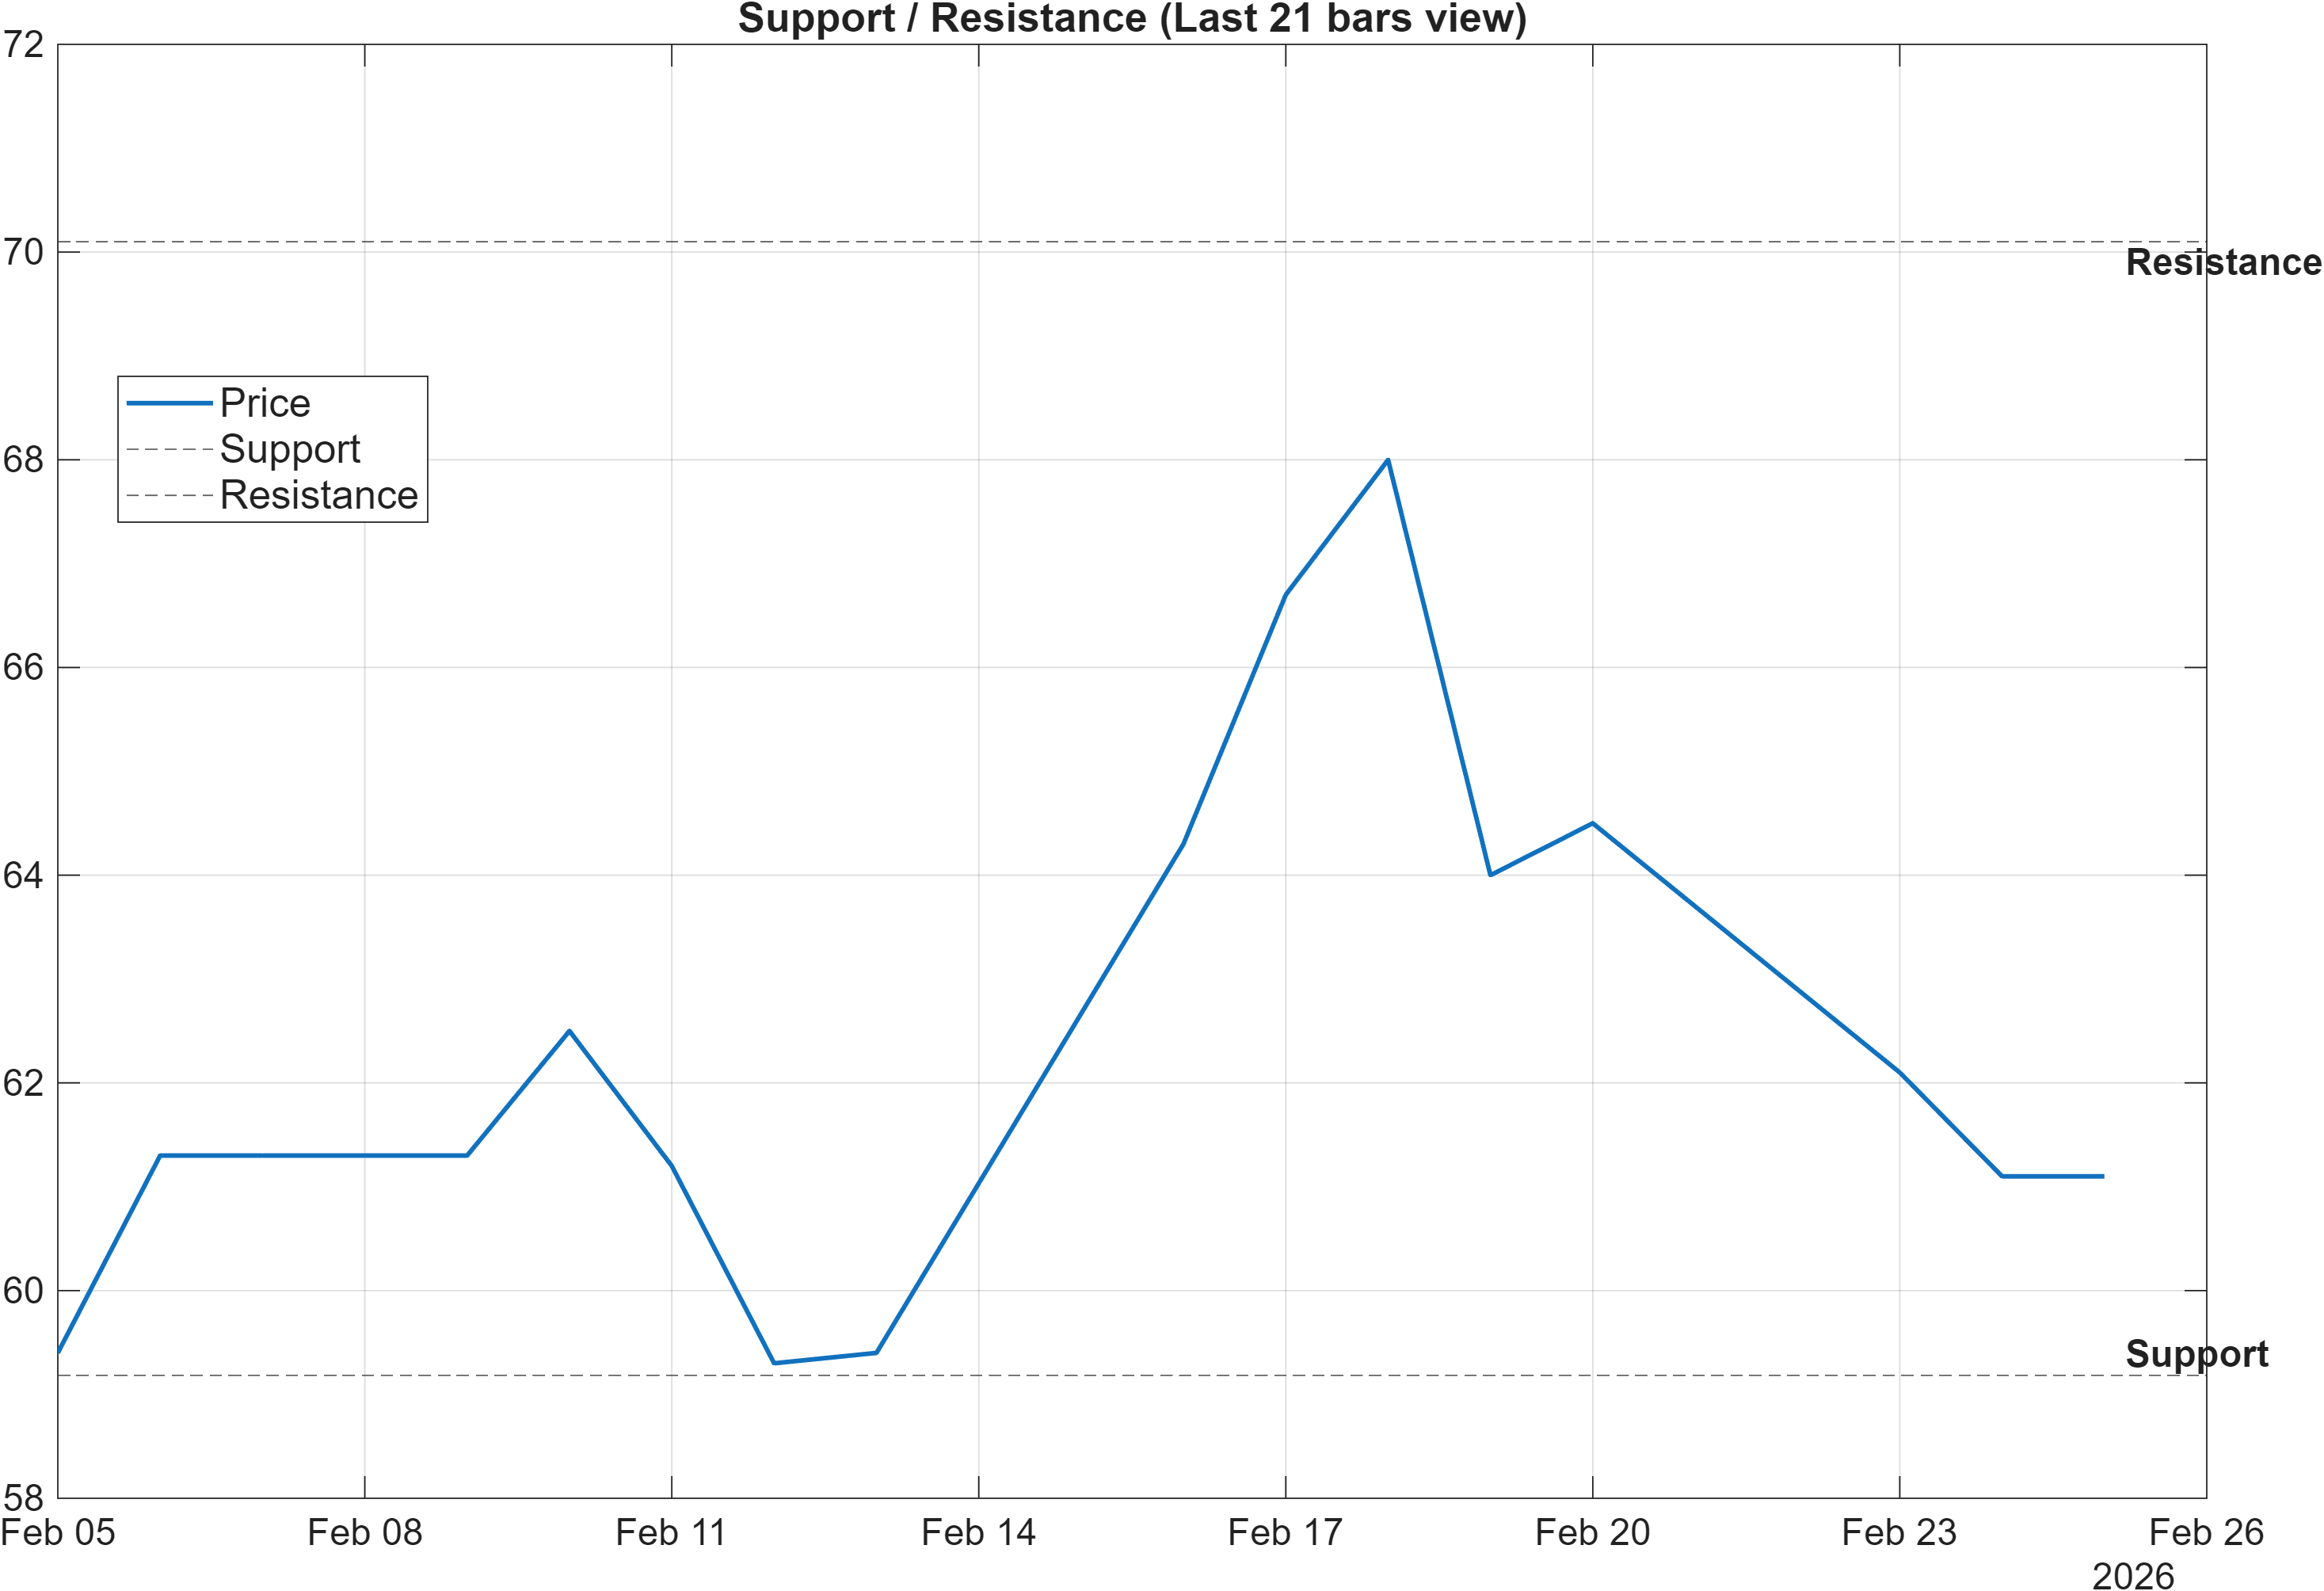
Scenario view: Break above resistance with volume → continuation. Close below support → signal deterioration risk.
Decision zones: probabilistic boundaries under weak rank pressure
The level structure is tight and interpretable: 59.1833 defines the near-term support zone, while 70.1000 is the principal resistance reference. With the trend regime flagged bearish (Close<MA50 and MA50<MA200) and short-horizon ranks deep in the lower tail (Daily #1391, Weekly #1383), these zones take on added importance as validation points rather than mere chart annotations.
From a positioning standpoint, resistance is where bearish regimes often “prove themselves.” A break above 70.1000 that is also confirmed by volume would be a meaningful regime test because it challenges the current structure while the AI rank pressure is negative. Absent volume confirmation, upside probes can be vulnerable to reversal back into the range.
On the downside, a close below 59.1833 would not only be a technical breakdown signal per the scenario guidance; it would also align with the negative impulse suggested by the MACD histogram (-0.1206). In a contained volatility regime (bandwidth 0.1413), breaks can be sharper than expected as volatility transitions from compression to expansion.
The most analytically useful approach here is conditional: treat 70.1000 as the threshold for bullish continuation attempts, and 59.1833 as the threshold where the current “bearish short/mid, neutral long” profile risks tipping into broader deterioration. Until either boundary is resolved, the instrument remains in a range-defined decision state.
5) Quant Technical Dashboard (18 Signals)
KGNAI AI Technical Analysis Score (Deep Reinforcement Learning): Rank #1264 out of 1425 (Rank 1 represents the strongest technical positioning and a higher probability of favorable price behavior. As ranks increase toward the maximum, the probability of favorable outcomes weakens and bearish positioning becomes more dominant.) | Label: Bearish | Score: -0.774
18-Signal Technical Confluence Score: -0.056 (Neutral)
Overall Technical Score (18-signal confluence + DRL rank blend): -0.271 (Neutral)
Note: The blended score reflects signal strength weighted against broader AI technical ranking, which may temporarily diverge.
Blended technical score breakdown: -0.271 (Neutral | Bull 6 / Bear 7 / Neutral 5)
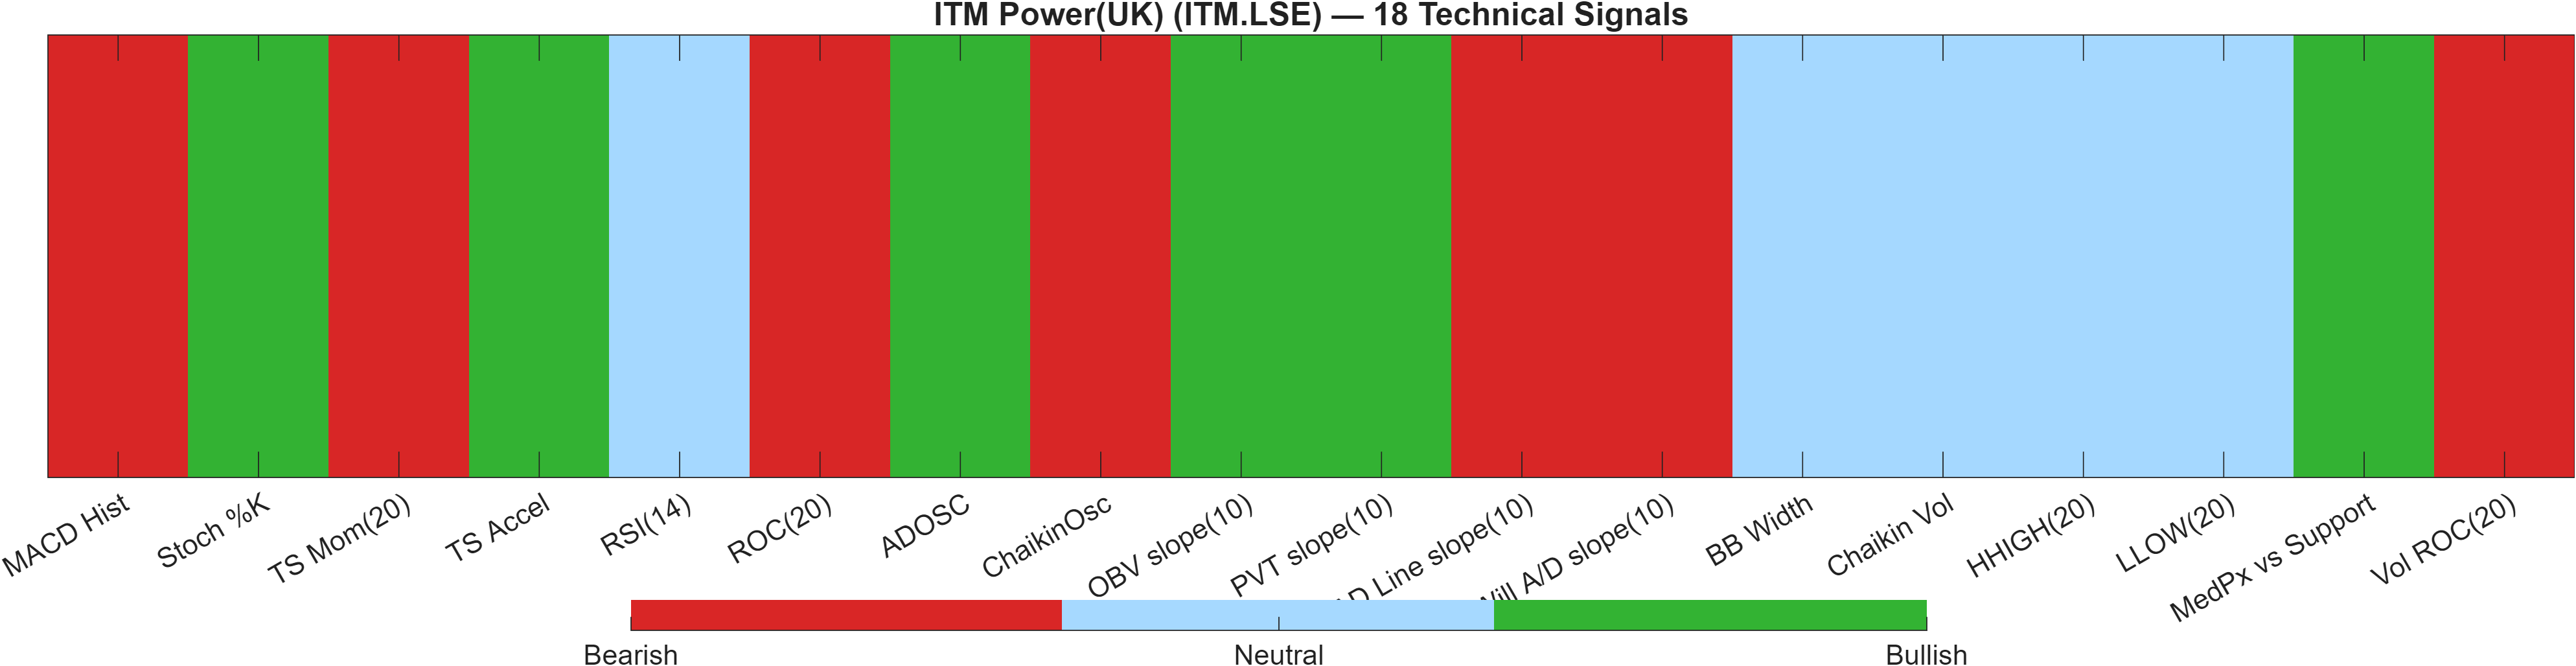
Confluence vs model rank: neutral surface, bearish underlay
The 18-signal confluence is slightly negative but still Neutral at -0.056, while the blended overall technical score remains Neutral at -0.271. This is a classic “mixed stack” profile: individual indicators are not unanimously bearish, yet the aggregate framework is not strong enough to offset the broader weakness implied by the separate AI technical ranking.
That tension is visible in the Deep Reinforcement Learning technical rank: #1264 out of 1425, labeled Bearish, with a score of -0.774. When the model rank is this weak, “neutral” confluence often reflects internal disagreement (some supportive breadth/flow readings) rather than a clean reversal setup.
Internal mix: breadth/flow positives vs price/impulse negatives
The breakdown (Bull 6 / Bear 7 / Neutral 5) supports the idea of a contested tape. For example, momentum/impulse pressure persists (MACD histogram -0.1206 is Bearish; TS Mom(20) is Bearish at -0.2), while select flow measures are constructive (e.g., ADOSC is Bullish at 64.71). Simultaneously, the volatility context remains muted (BB Width 0.1413 is Neutral), which can keep signals from resolving quickly.
Signal table (Bull/Bear/Neutral)
| Indicator | Value | Signal |
|---|---|---|
| MACD Hist | -0.1206 | Bearish |
| Stoch %K | 17.54 | Bullish |
| TS Mom(20) | -0.2 | Bearish |
| TS Accel | 4.2 | Bullish |
| RSI(14) | 49.73 | Neutral |
| ROC(20) | -0.3263 | Bearish |
| ADOSC | 64.71 | Bullish |
| ChaikinOsc | -7.016e+05 | Bearish |
| OBV slope(10) | 1.697e+06 | Bullish |
| PVT slope(10) | 5.231e+04 | Bullish |
| AD Line slope(10) | -1.418e+06 | Bearish |
| Will A/D slope(10) | -5.44 | Bearish |
| BB Width | 0.1413 | Neutral |
| Chaikin Vol | -5.535 | Neutral |
| HHIGH(20) | 70.5 | Neutral |
| LLOW(20) | 57.9 | Neutral |
| MedPx vs Support | 1.936 | Bullish |
| Vol ROC(20) | -40.05 | Bearish |
Interpretation: Indicator-level signals form the base confluence, which is then adjusted using a separate AI-driven technical ranking model. The final technical score summarizes this combined view.
6) News sentiment + extractive gist
Note: Instrument-specific news matches were not found, so the digest includes broader market/sector headlines. Links are provided for verification.
Sentiment score (avg): 0.026 | Positive: 12% | Neutral: 88% | Negative: 0%
KGNAI AI News Sentiment Score (normalized -1 to +1): 1.00 (as of 2025-10-22) | Label: Bullish | Overall news score: 0.97
Positive Developments
Recent coverage across major financial outlets skews constructive in tone in the sentiment aggregation, consistent with the dataset’s positive/neutral mix (Positive 12%, Neutral 88%, Negative 0%) and the normalized score of 1.00. However, because instrument-specific matches were not available in the provided data, the positive read should be treated as contextual rather than company-specific. In that setting, sentiment primarily functions as a background risk-on/risk-off indicator rather than a direct catalyst measure for ITM.LSE. The practical implication is that a supportive information backdrop may reduce headline-driven downside shocks, but it does not override the current technical regime: the short-horizon ranks remain weak (Daily #1391, Weekly #1383) and the trend read is bearish versus the MA stack. If price action begins to improve into resistance (70.1000), constructive sentiment may help sustain follow-through, but only if confirmed by price/volume.
Neutral / Mixed Developments
The news mix also contains a heavy share of informational items, which aligns with the high neutral percentage (88%) and the low average sentiment magnitude (0.026). This combination can occur when the content flow is active but not directly market-moving for the instrument being analyzed. For ITM.LSE, that means sentiment may be less useful for timing than for framing: it can help explain why volatility remains relatively contained (Bollinger bandwidth 0.1413) despite weak ranks. In mixed regimes like this, markets often defer to technical boundaries—support (59.1833) and resistance (70.1000)—to resolve direction, while sentiment remains a secondary input that can tilt conviction but rarely replaces confirmation.
Negative / Risk Signals
Despite the dataset showing 0% negative share in the sentiment bucket, risk signals still exist at the regime level. When short-horizon ranks are deep in the weakest slice of the universe (Daily #1391, Weekly #1383) and momentum impulse is negative (MACD histogram -0.1206), the market can react more sharply to any adverse macro or sector narrative, even if that narrative is not instrument-specific. The key risk is not “bad headlines” per se; it is fragile technical positioning meeting a volatility transition. With bandwidth at 0.1413, a move out of compression—especially through 59.1833—can reprice risk quickly. As a result, the most relevant risk monitoring is whether price violates support on a closing basis, and whether any upside attempt fails repeatedly below 70.1000.
- What to monitor next: Does price reclaim and hold above 70.1000 with volume confirmation?
- What to monitor next: Do momentum conditions improve (e.g., MACD histogram turning less negative from -0.1206) while RSI remains near the midpoint (49.73)?
- What to monitor next: Any close below 59.1833 alongside expanding volatility from 0.1413.
Snapshot: AI Rank (Short–Mid–Long): Mixed (Bearish tilt) (Bearish–Bearish–Neutral) · Technical Confluence: Neutral · Key Levels: Support ~59.18 | Resistance ~70.10 · News Sentiment: Neutral
Sources referenced: Reuters, Bloomberg, Yahoo Finance, MarketWatch, Investing.com
7) Sources
- Trump focuses on economy in State of Union address as Iran crisis looms — https://www.ft.com/content/405f9683-4299-4a0b-b91c-5cfe1b74505f
- Top Democrats demand Trump justify motivations for potential Iran attack — https://www.ft.com/content/0fa86c96-46d5-44fa-9fdc-e53e5f5c1332
- Donald Trump’s state of mind is a global risk — https://www.ft.com/content/8802f7de-8458-4c86-90d3-8080df928ec1
- Reeves aims to reassure business with ‘boring’ Spring Statement — https://www.ft.com/content/f9618f2b-89c9-4f34-a007-82072f344ddc
- Why are there still so few women CEOs? — https://www.ft.com/content/57ceb556-681f-471b-9f13-28fcdfd65193
- Warner Bros says sweetened Paramount bid may top Netflix deal — https://www.ft.com/content/aaa4b817-6574-4606-80f7-b12187774e23
- Mandelson's lawyers deny he was planning to flee abroad — https://www.ft.com/content/5910671d-26fc-452b-8011-8f51e7f19e10
- MPs back release of files about hiring of former prince as UK trade envoy — https://www.ft.com/content/25cc222f-8d94-47c1-bba9-3d68c6d64207
You may also like: How KGNAI AI ranks instruments across global markets
Disclaimer: KGNAI provides AI-generated analytics and educational market commentary only. This is not financial advice. Markets involve risk. Always do your own research.