
MUX.F — Mutares SE & Co. KGaA (22-Feb-2026) | Long-term strength with near-term consolidation signals
Mutares SE & Co. KGaA (MUX.F) is currently characterized by a long-horizon ranking profile that remains constructive, while shorter horizons lean more range-bound. In the KGNAI cross-sectional universe (1425 instruments, EUROPE), longer-term ranks are positioned near the very top of the distribution (notably #20 on the 6‑Monthly and #17 on the Yearly), even as intermediate ranks (Weekly #646; Monthly #1007) indicate a less directional, consolidative phase. Technically, the blended view is also mixed: the 18-signal confluence is 0.333 (Bullish), but the Deep Reinforcement Learning technical rank is #1185 with a Bearish label, pulling the combined score to 0.034 (Neutral). Momentum and volatility measures reinforce the “stability without expansion” framing: RSI is neutral-to-positive at 57.63, MACD histogram is mildly positive at 0.0511, and Bollinger bandwidth remains relatively contained at 0.0676. Key decision zones sit near 29.4667 (support) and 33.8500 (resistance).
- Rank stance: Short-term Neutral | Mid-term Neutral | Long-term Bullish (6‑Monthly #20; Yearly #17)
- Technical confluence: 18-signal confluence 0.333 Bullish; blended score 0.034 Neutral
- Key levels: Support ~ 29.4667 | Resistance ~ 33.8500
- News sentiment bias: Avg sentiment 0.084; mix 40% positive / 60% neutral / 0% negative → Neutral
- Confirmation / invalidation: A sustained push above 33.8500 with volume favors continuation; a close below 29.4667 increases deterioration risk.
KGNAI evaluates assets using large cross-sectional datasets built from millions of structured data points. Inputs incorporate fundamental metrics, technical structures, and systematically processed news sentiment. Statistical models, machine learning, and AI frameworks are used to assess relative positioning, signal alignment, and probabilistic behavior across broad universes.
- Ranks are comparative across the tracked universe, not absolute price targets.
- Confluence reflects alignment among independent signal groups.
- Support/resistance levels are probabilistic decision zones, not guarantees.
- Sentiment provides contextual bias within the broader analytical framework.
1) KGNAI AI Analysis
Region: EUROPE
Total universe size: 1425 ranked instruments
- Daily rank: #163 out of 1425 — Bullish
- Weekly rank: #646 out of 1425 — Neutral
- Monthly rank: #1007 out of 1425 — Neutral
- 3-Monthly rank: #63 out of 1425 — Bullish
- 6-Monthly rank: #20 out of 1425 — Bullish
- Yearly rank: #17 out of 1425 — Bullish
The rank term structure is the main feature: long-horizon positioning is strong (Yearly #17 and 6‑Monthly #20 place MUX.F in the top decile), while the mid-horizon profile is comparatively muted (Weekly #646 and Monthly #1007 sit closer to the middle-to-lower half of the universe). This pattern often appears when a broader uptrend remains intact but the market is reassessing price acceptance after a prior advance—producing a “pause” that can persist until new information or liquidity conditions re-accelerate participation.
Shorter horizons are not uniformly weak. The Daily rank (#163) remains bullish and the 3‑Monthly rank (#63) is also bullish, suggesting that near-term behavior can still be constructive even if the weekly-to-monthly layer is less aligned. From a regime lens, this is better described as rotation and digestion rather than a clean deterioration, because the top-ranked long-term layers are not collapsing while the shortest layer remains supportive.
Term view in the provided data is: Short-term Neutral, Mid-term Neutral, Long-term Bullish. The most analytically relevant implication is that confirmation is likely to be expressed through level-based breaks (Section 4) and a reduction in technical-model divergence (Section 5), rather than by relying on any single horizon rank in isolation.
Want the full universe and complete rank tables? Unlock full access on KGNAI: https://www.kgnai.com/pricing
2) Price & trend overview
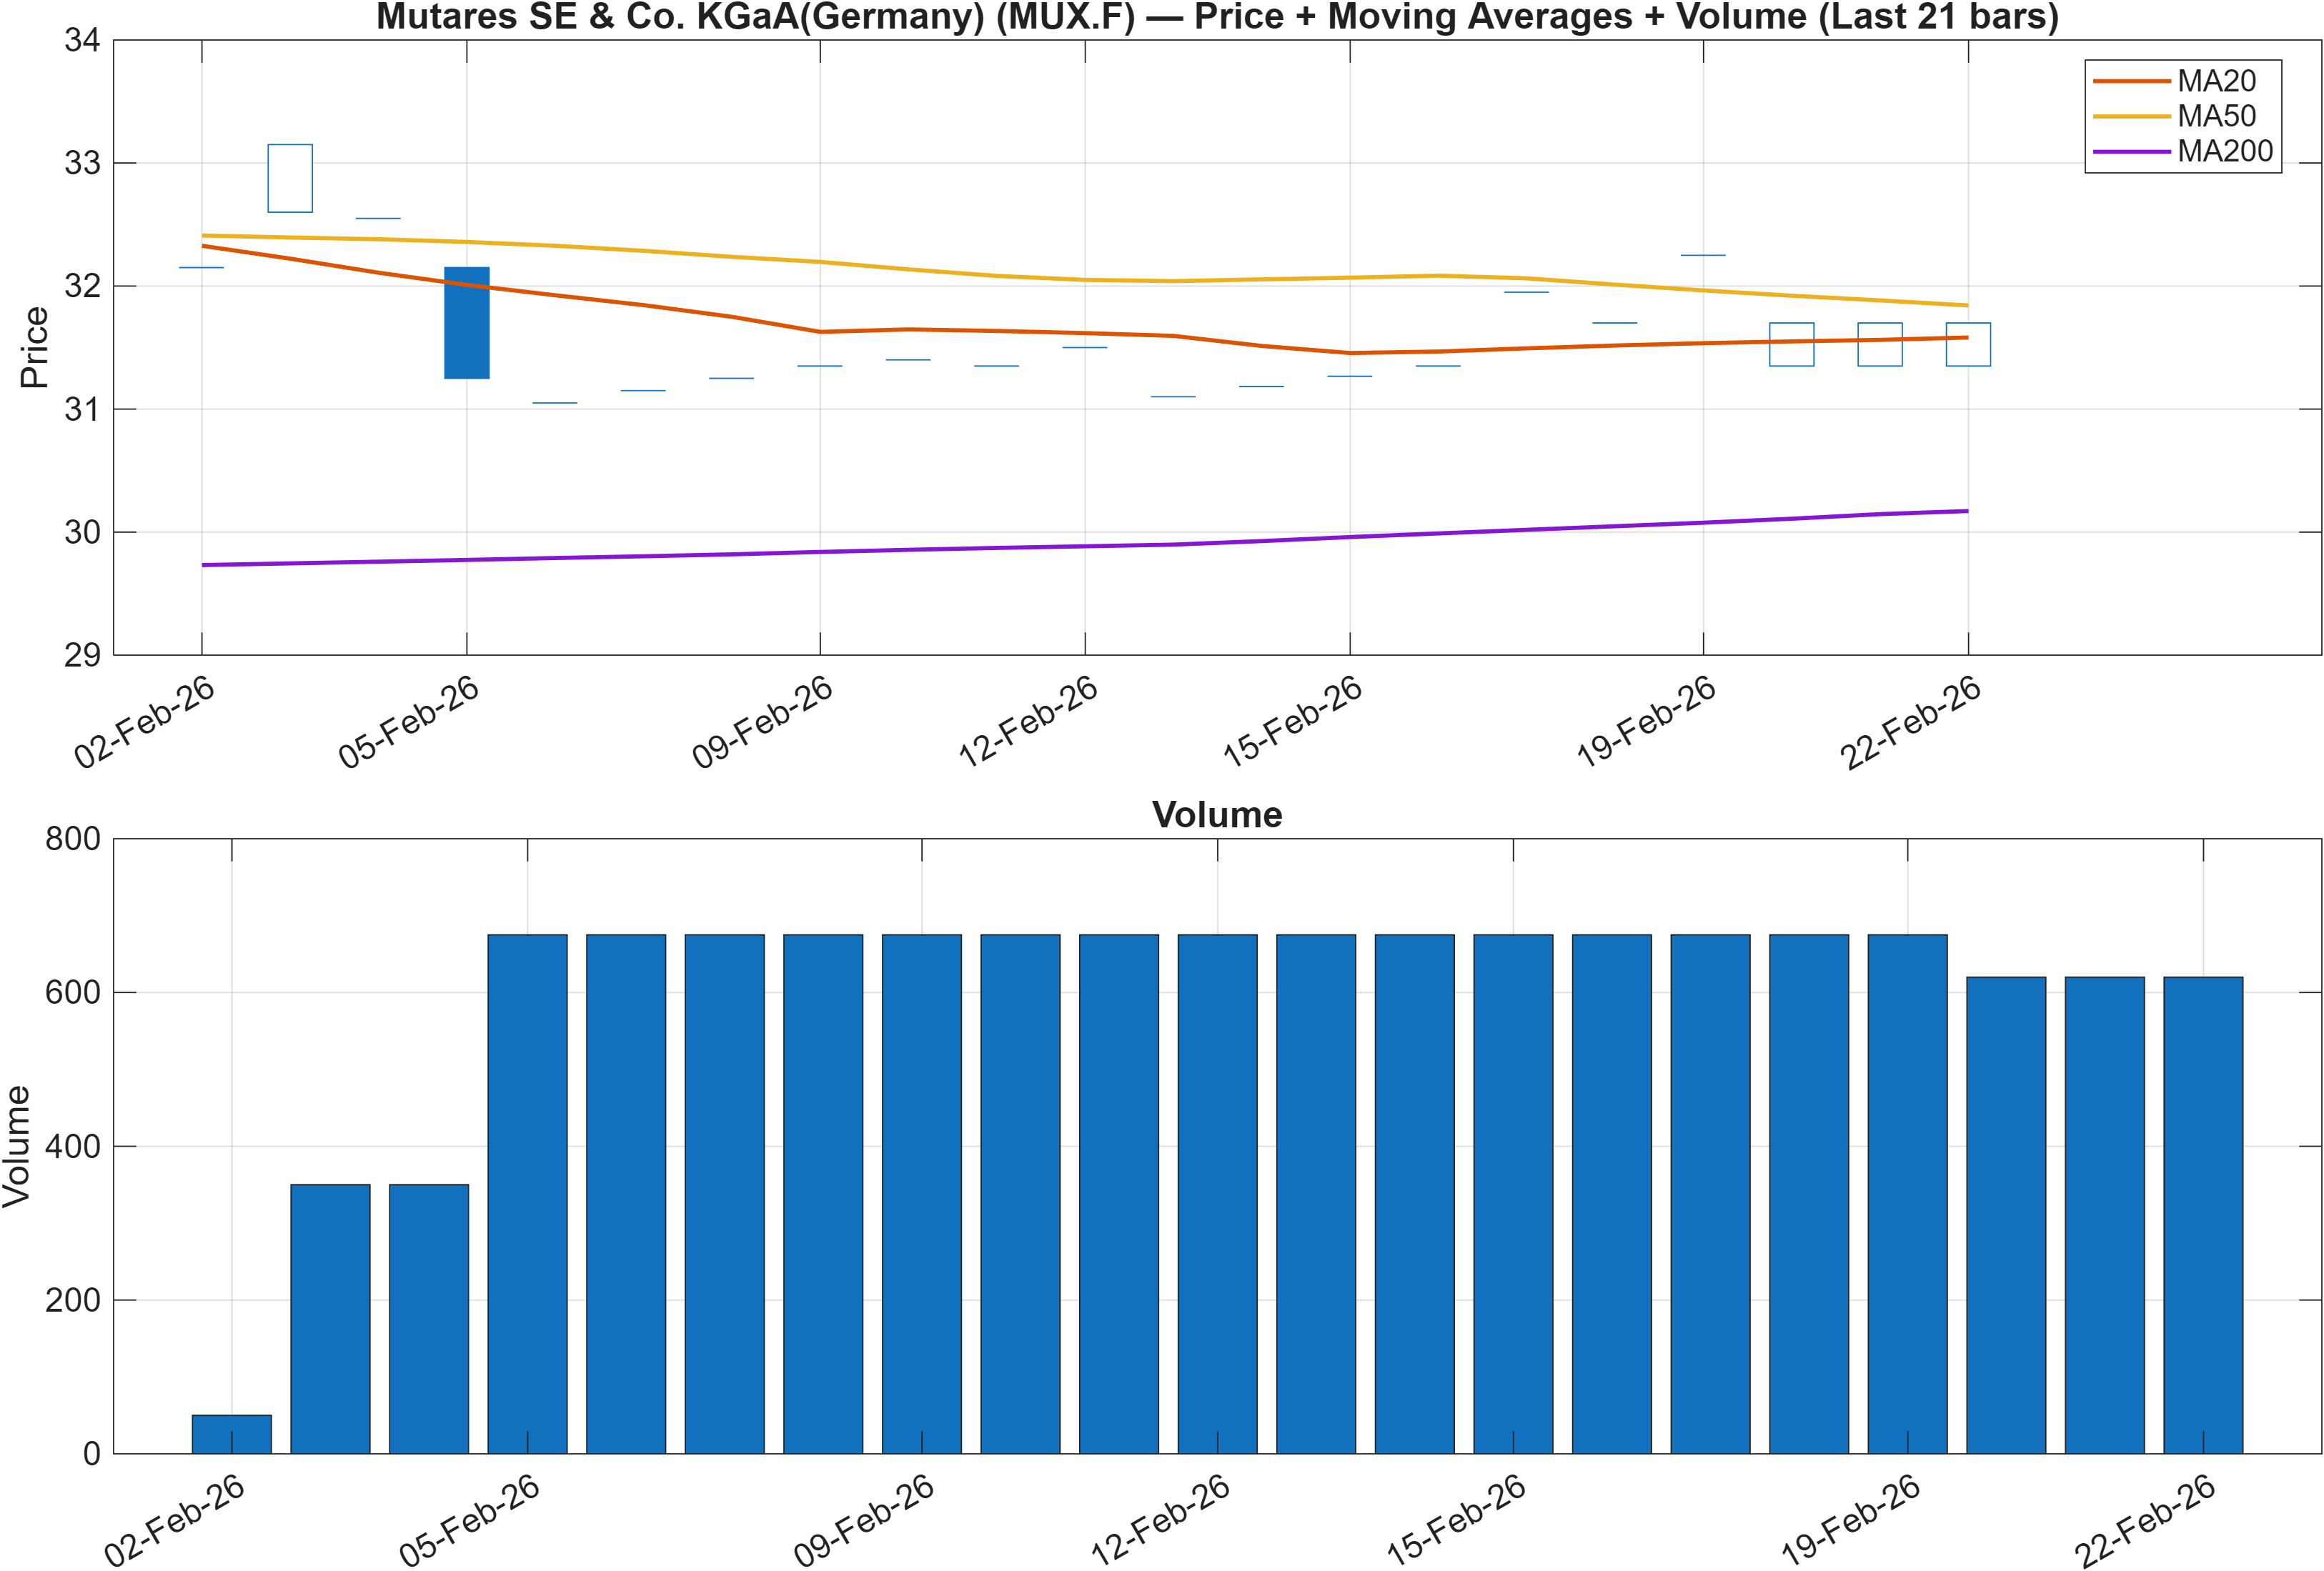
The moving-average configuration shows a split trend message: Close vs MA50 = Bearish, while MA50 vs MA200 = Bullish. That combination typically describes a longer trend that remains upward (a constructive medium/long structure), alongside a nearer-term pullback or consolidation that keeps spot price from reclaiming the faster average. In other words, trend persistence exists in the background, but immediate follow-through is not yet dominant.
This aligns cleanly with the rank term structure: top-decile long-horizon ranks (Yearly #17; 6‑Monthly #20) are consistent with MA50 holding above MA200, while the less supportive Monthly rank (#1007) is consistent with price trading in a less directional lane relative to the MA50. The market structure implication is that trend strength is more structural than tactical at this point—meaning that entries and risk controls tend to be more sensitive to levels (support/resistance) and confirmation (volume) than to a simple “trend on / trend off” read.
The most relevant question for price action is whether the market transitions from “stability” to “expansion.” With the nearby decision band identified at 33.8500 (resistance) and 29.4667 (support), the current moving-average split argues for patience: a reclaim of the MA50 typically improves the odds of resistance pressure, while failure to stabilize can bring the lower boundary into play. The provided framework emphasizes confirmation/invalidation zones rather than point forecasts; in that spirit, trend assessment remains conditional on how price behaves as it approaches those zones.
3) Momentum & volatility dashboard
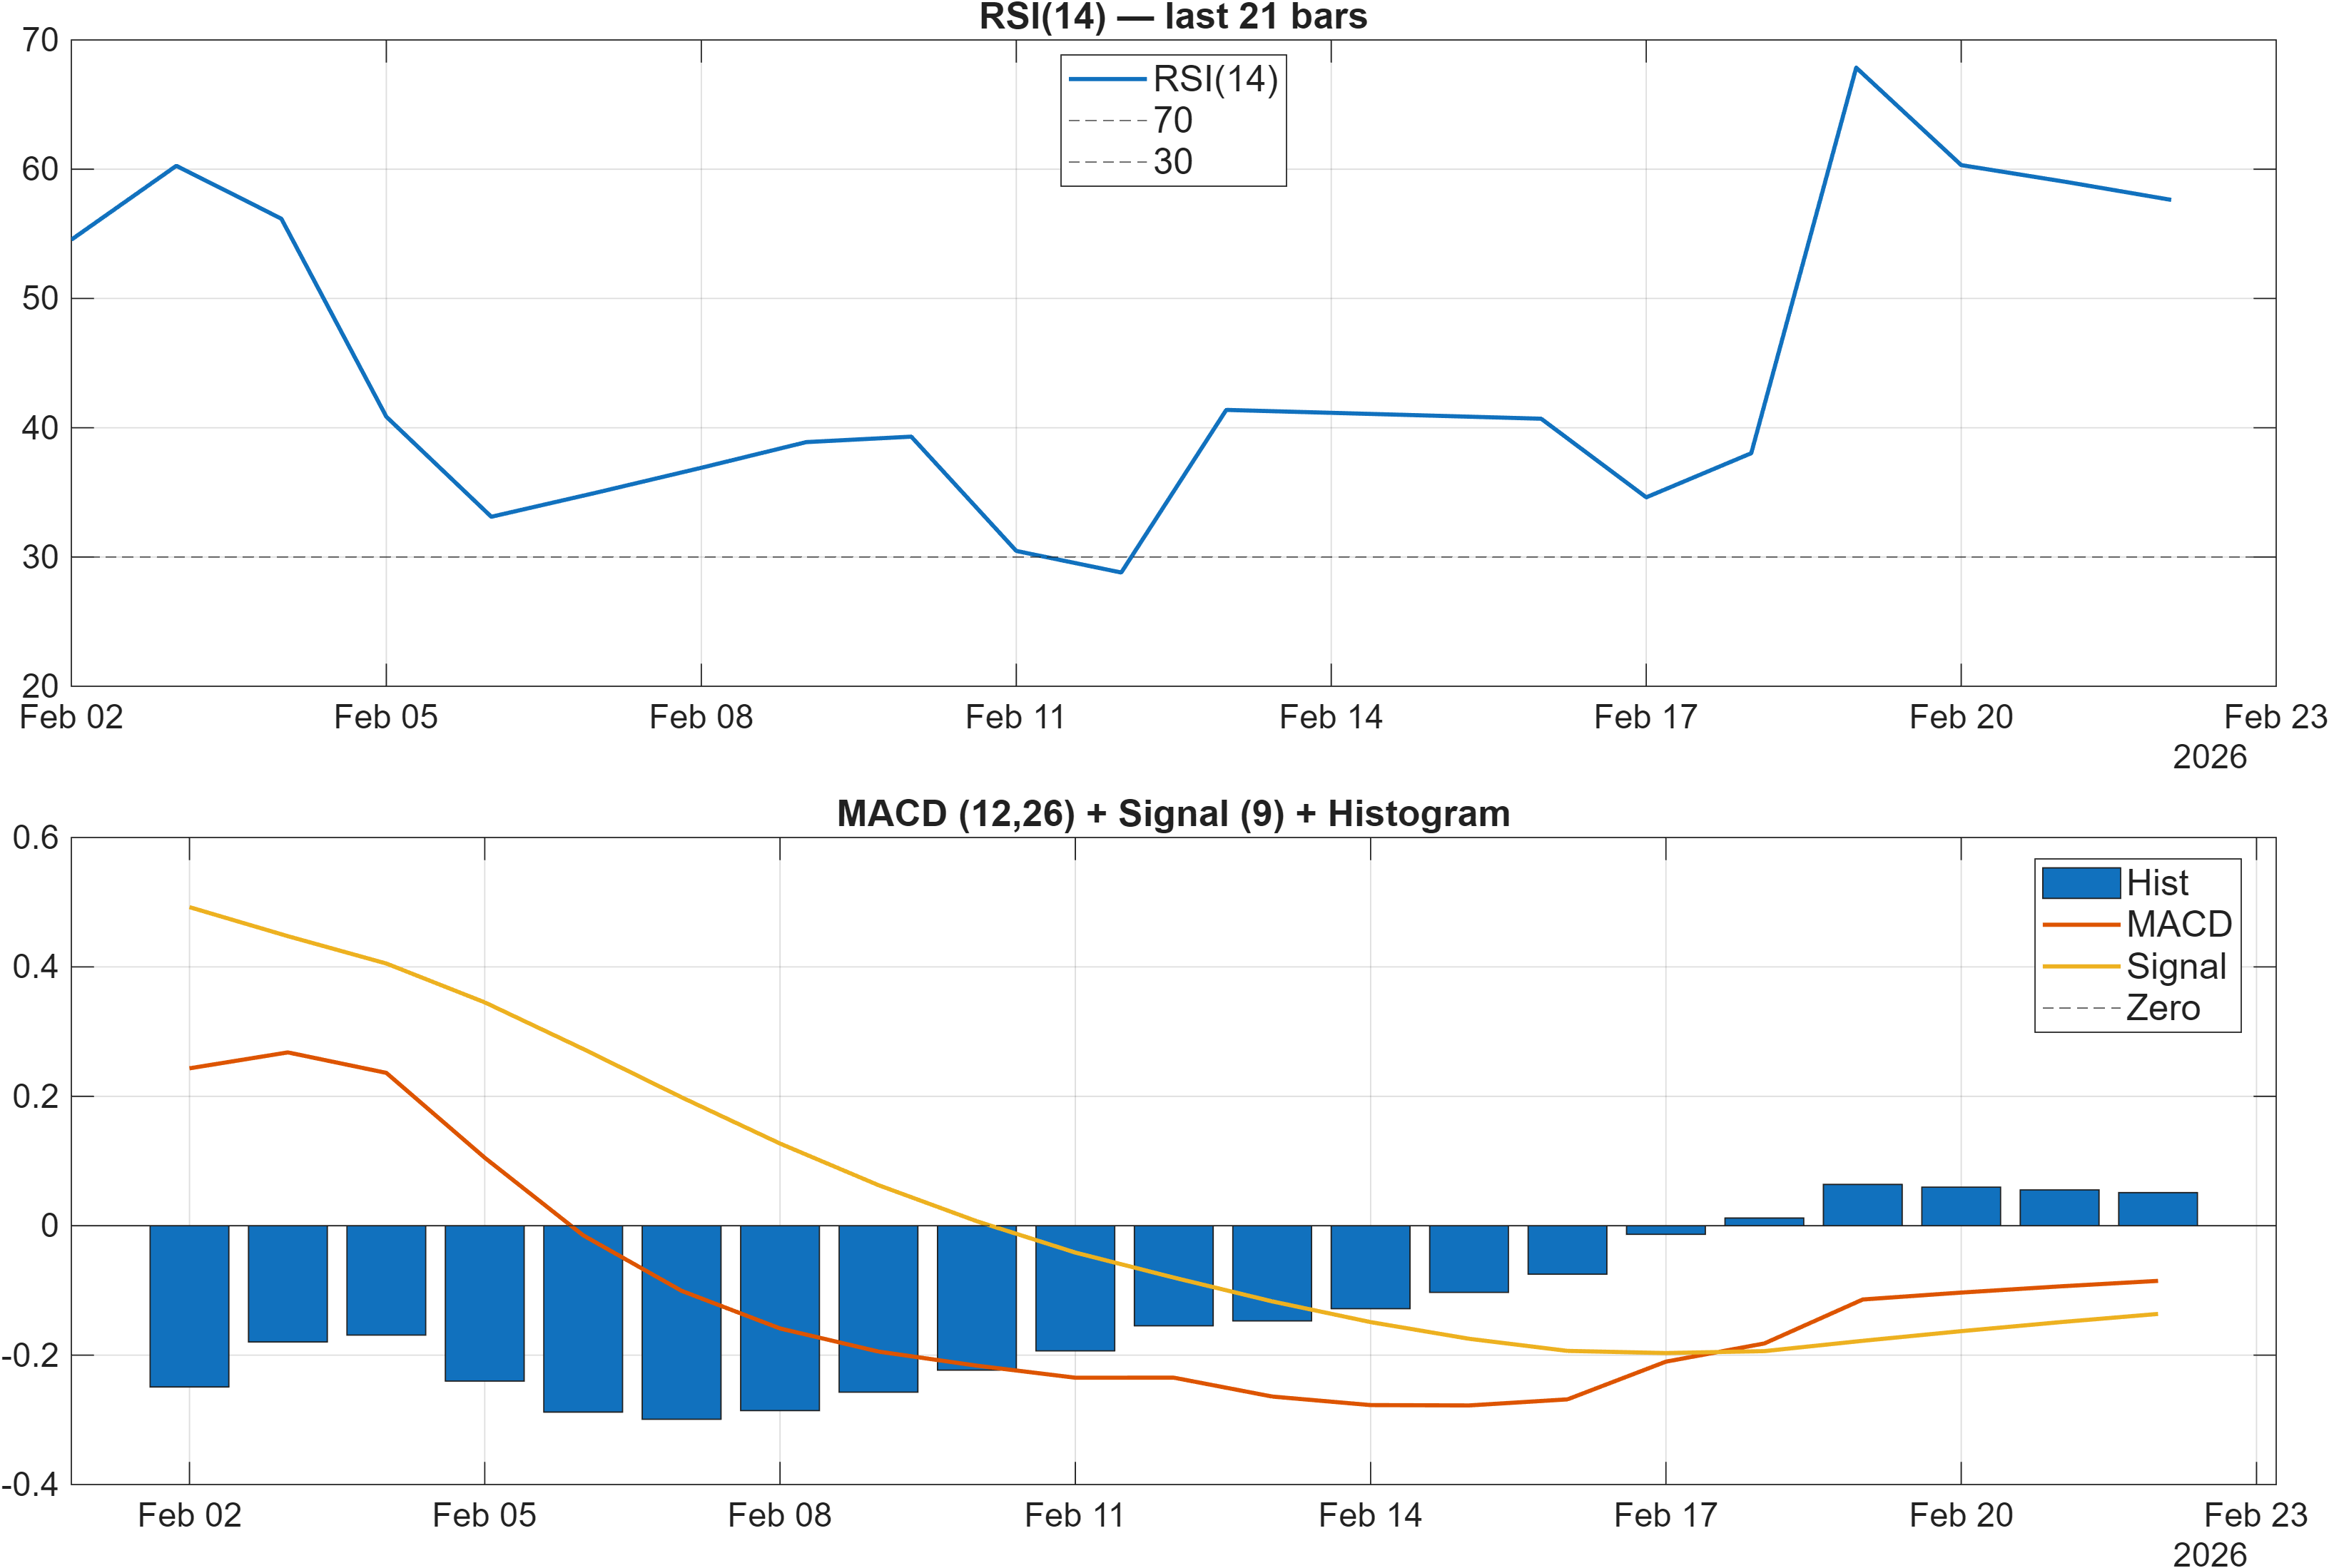
Interpretation: RSI bias = Neutral, MACD hist = 0.0511.
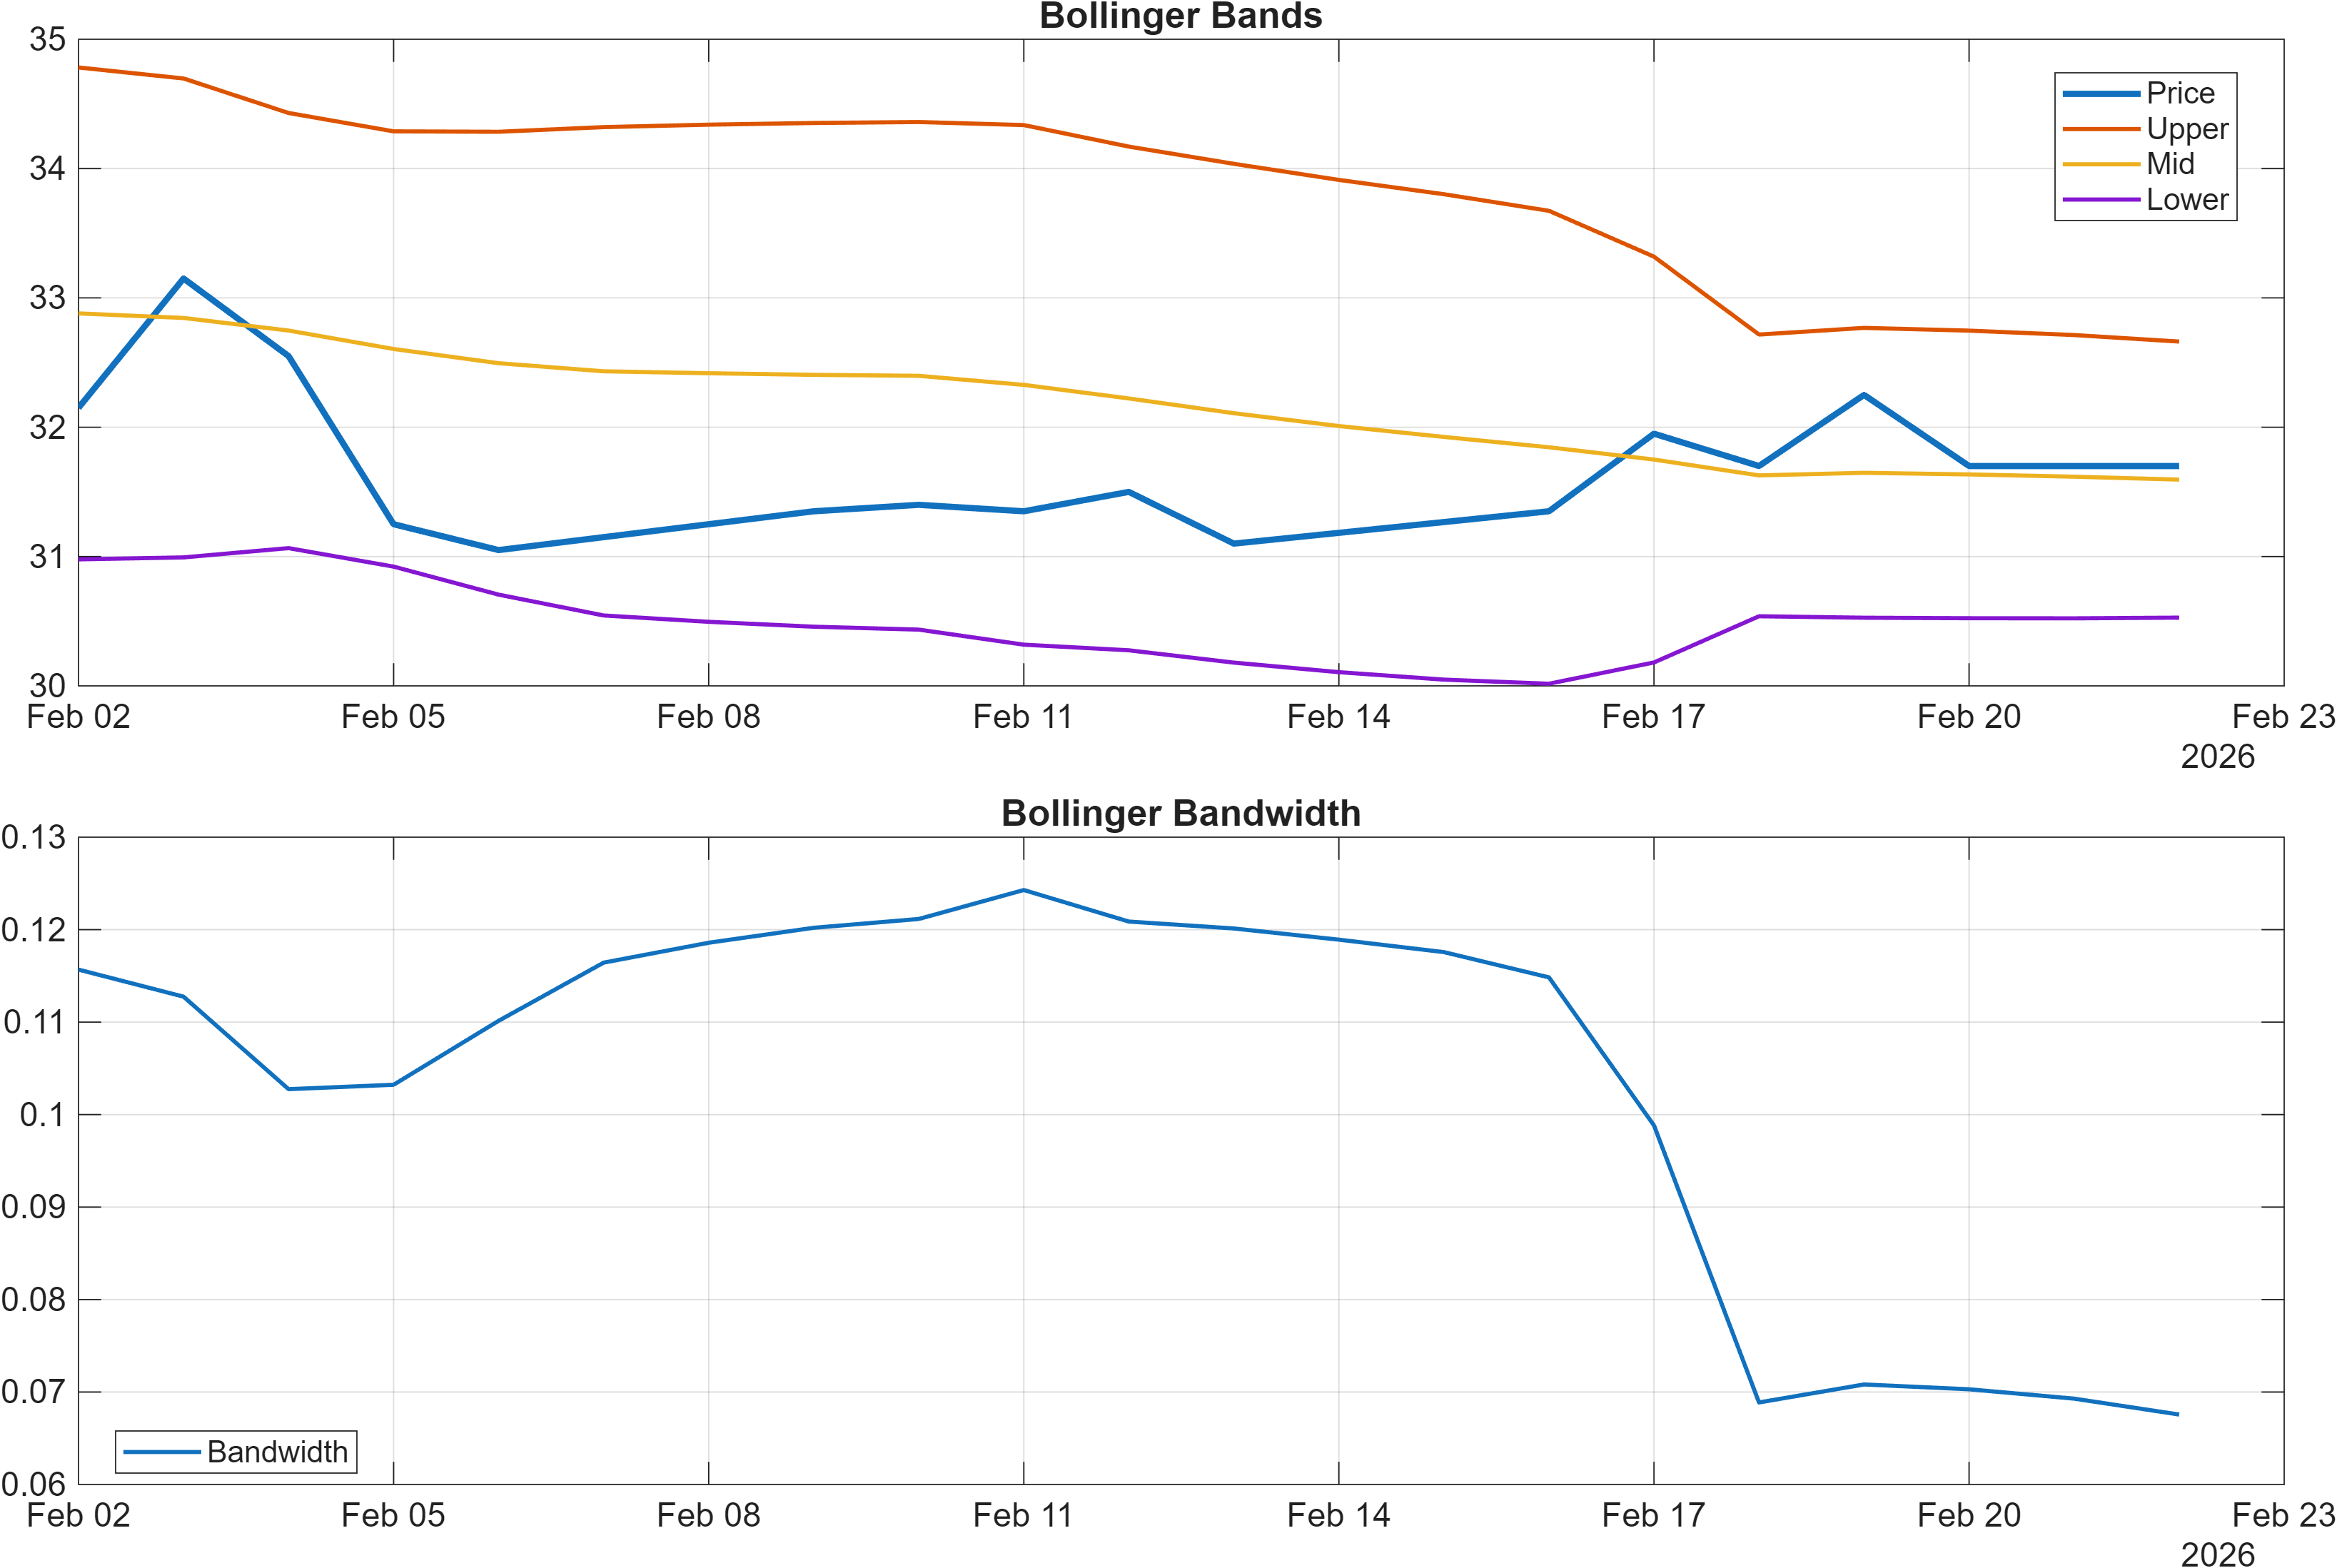
Interpretation: Bandwidth (volatility regime) latest = 0.0676.
Momentum is tilted mildly constructive but not forceful. The MACD histogram at 0.0511 indicates positive momentum pressure on this measure, yet the stated RSI bias is Neutral with RSI(14) at 57.63 (from the signal table), a level that is supportive but not typically associated with extended conditions. This “positive-but-contained” configuration tends to fit consolidation regimes: the market is not broadly overbought, but it also is not displaying the kind of accelerating momentum that reliably forces breakouts.
Volatility conditions reinforce the same theme. Bollinger Bandwidth at 0.0676 (and BB Width 0.06757 in the signal table) points to a comparatively compressed regime. Compression can precede expansion, but the data here does not specify direction; instead, it elevates the importance of confirmation around structural levels. In these regimes, false starts are common, and model disagreement (seen later in the DRL technical rank) can persist until volatility expands.
Cross-checking with individual momentum metrics from the dashboard adds nuance: TS Mom(20) at -1.45 and ROC(20) at -4.374 register bearish on those specific lenses even as MACD remains positive. That divergence is consistent with momentum normalization—a situation where the market has stopped accelerating and is working off prior gains, while shorter-cycle signals begin to recover first. Practically, that puts more weight on whether price can build acceptance above resistance or whether compression resolves lower through support.
4) Support / Resistance zones
Support ~ 29.4667 | Resistance ~ 33.8500
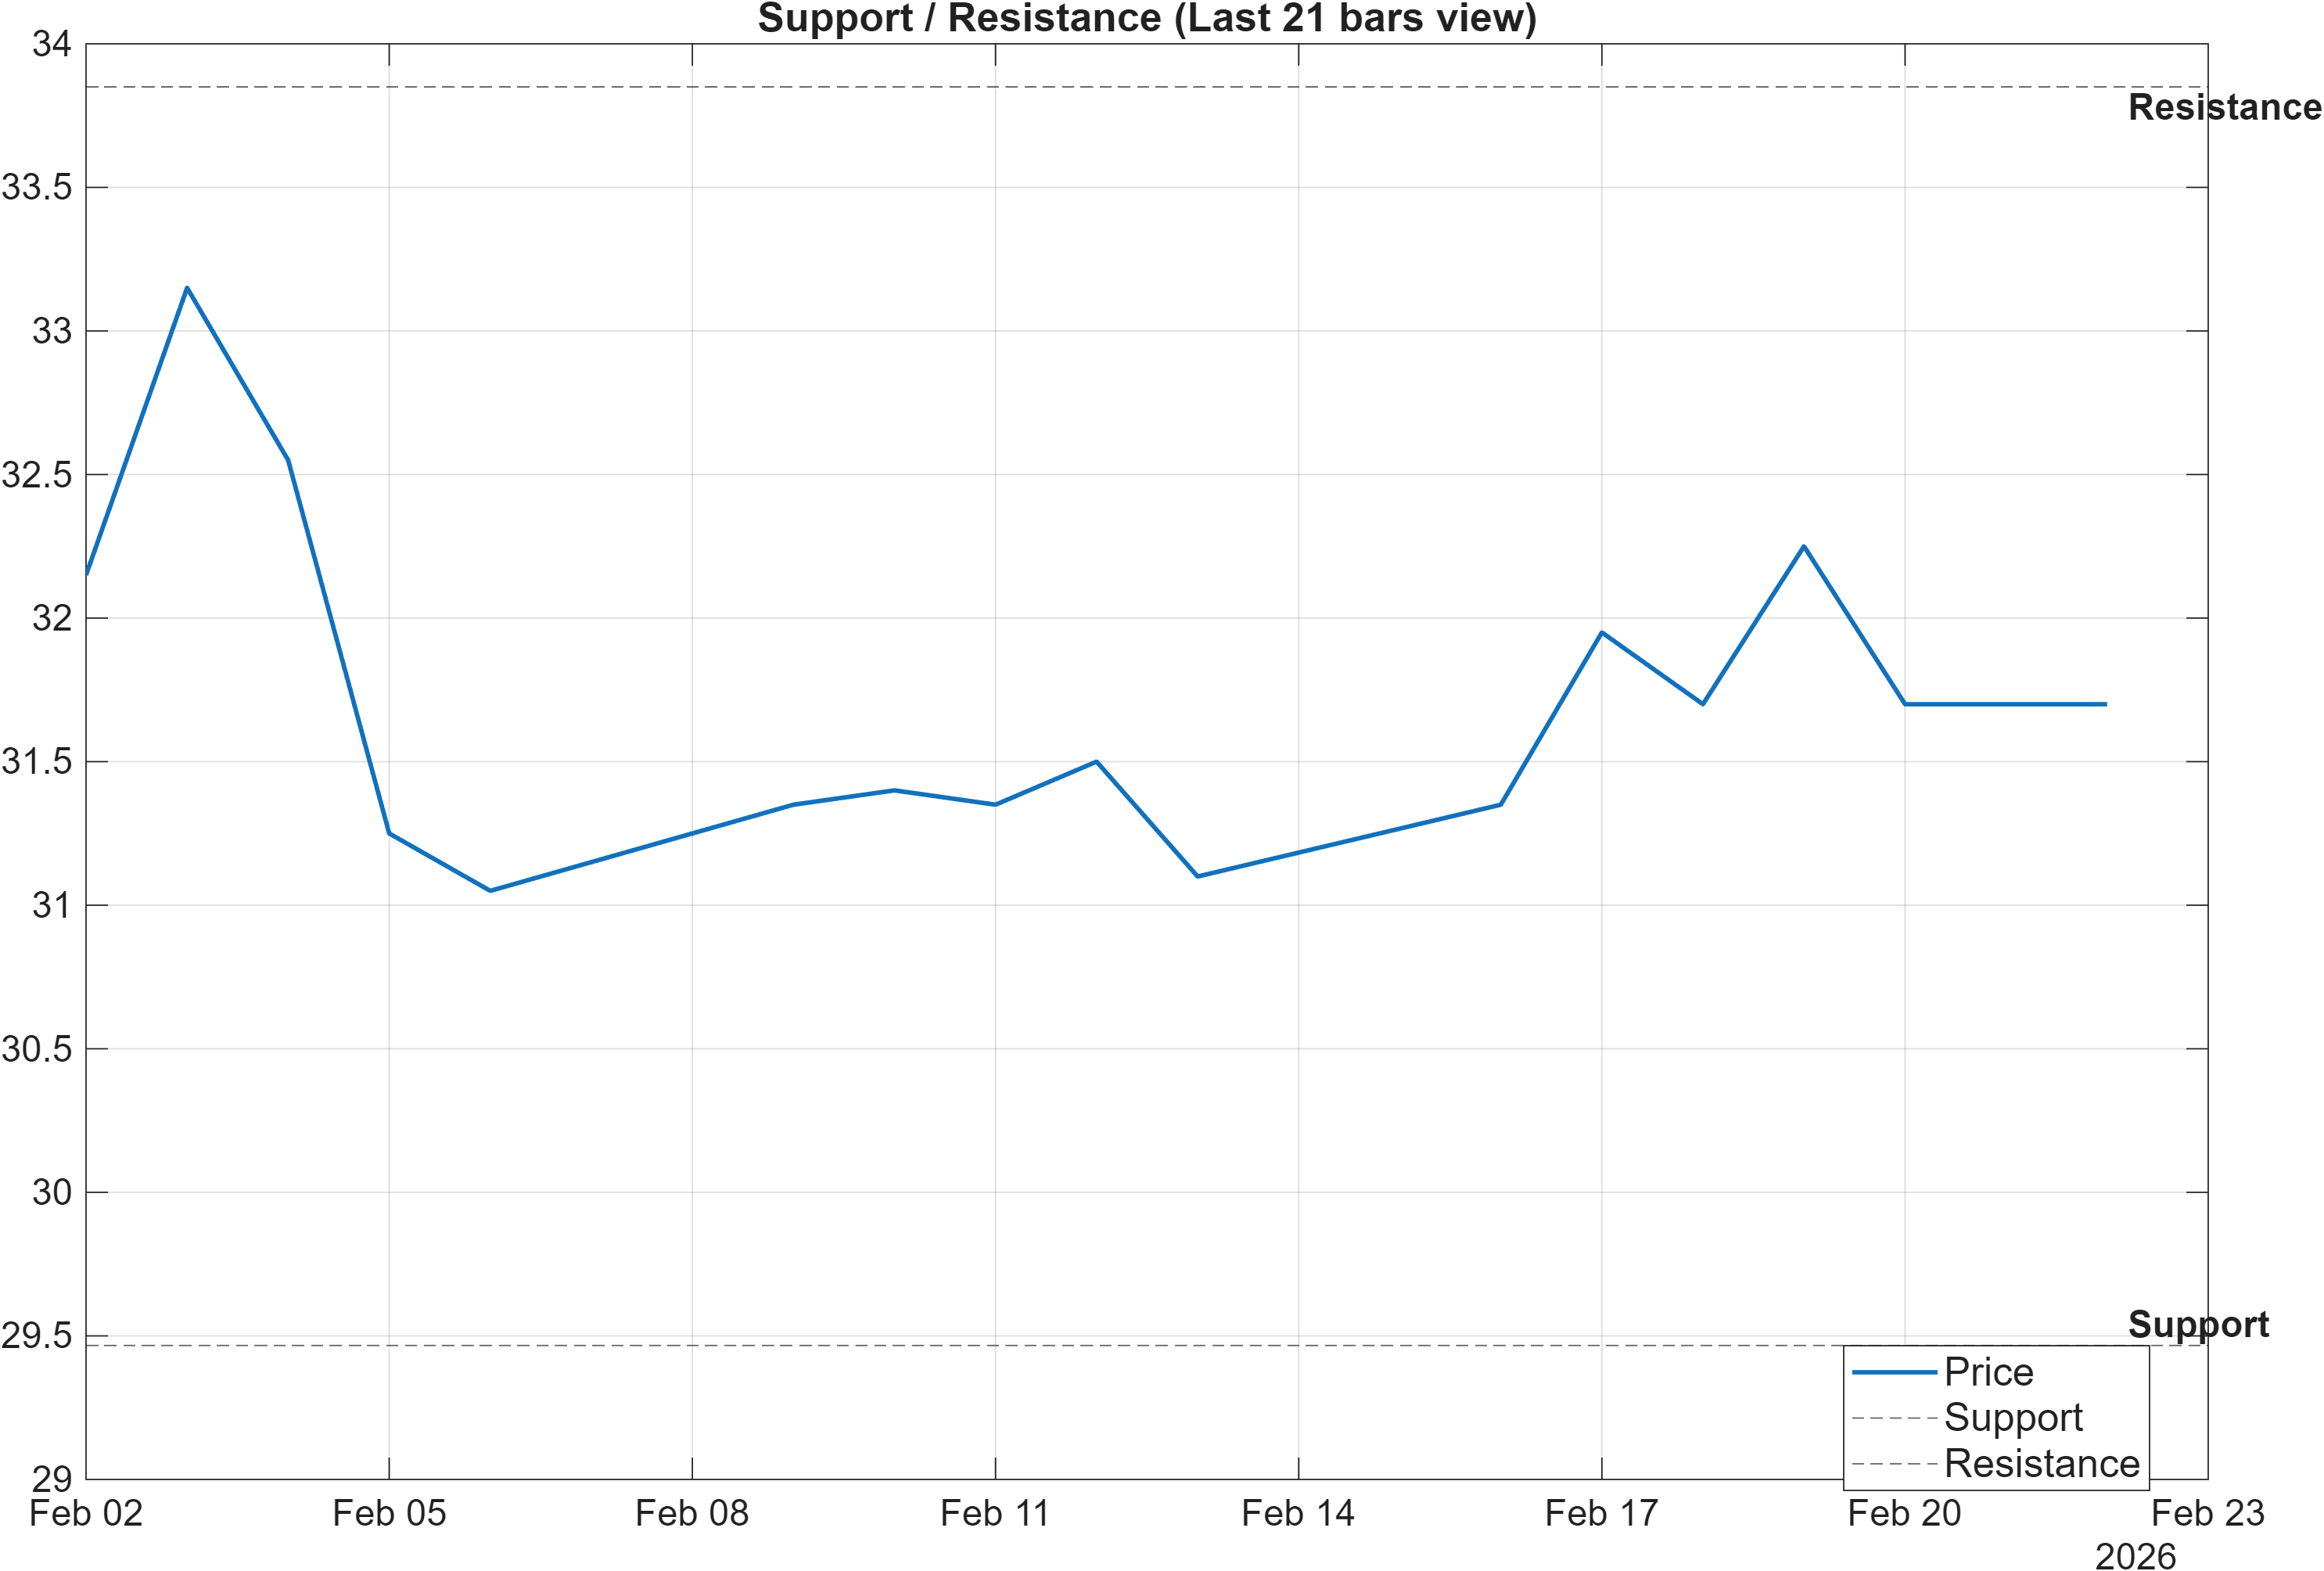
The level map is relatively clean, which matters because other parts of the stack are mixed. The primary decision zones are 29.4667 on the downside and 33.8500 on the upside, and the scenario guidance in the provided data explicitly links outcomes to confirmation: a break above resistance with volume implies continuation, while a close below support raises deterioration risk.
Two features from the signal set support a level-driven approach. First, MedPx vs Support = 2.058 is bullish, implying price is not currently pressed directly into the support zone; this can reduce the probability of immediate breakdowns but also means risk/reward profiles shift quickly if price drifts toward the boundary. Second, the 20-day range markers (HHIGH(20) 33.15, LLOW(20) 31.05) are both neutral, consistent with an intermediate range forming beneath the headline resistance at 33.8500.
Structurally, this is a compression-to-resolution setup: Bollinger bandwidth at 0.0676 suggests the market may be coiling, and the long-term ranks (6‑Monthly #20; Yearly #17) suggest that, if a breakout does occur, the path of least resistance may be more consistent with the longer-term bias. However, the moving-average note (Close vs MA50 = Bearish) argues that the market still needs to prove acceptance before treating resistance as “broken” rather than “tested.”
From a risk framing perspective, 29.4667 is the invalidation anchor for the constructive thesis implied by long-horizon ranks. If that level fails on a closing basis, the mixed intermediate ranks (Weekly #646; Monthly #1007) would have more room to dominate the narrative.
5) Quant Technical Dashboard (18 Signals)
KGNAI AI Technical Analysis Score (Deep Reinforcement Learning): Rank #1185 out of 1425 (Rank 1 represents the strongest technical positioning and a higher probability of favorable price behavior. As ranks increase toward the maximum, the probability of favorable outcomes weakens and bearish positioning becomes more dominant.) | Label: Bearish | Score: -0.663
18-Signal Technical Confluence Score: 0.333 (Bullish)
Overall Technical Score (18-signal confluence + DRL rank blend): 0.034 (Neutral)
Note: The blended score reflects signal strength weighted against broader AI technical ranking, which may temporarily diverge.
Blended technical score breakdown: 0.034 (Neutral | Bull 10 / Bear 4 / Neutral 4)
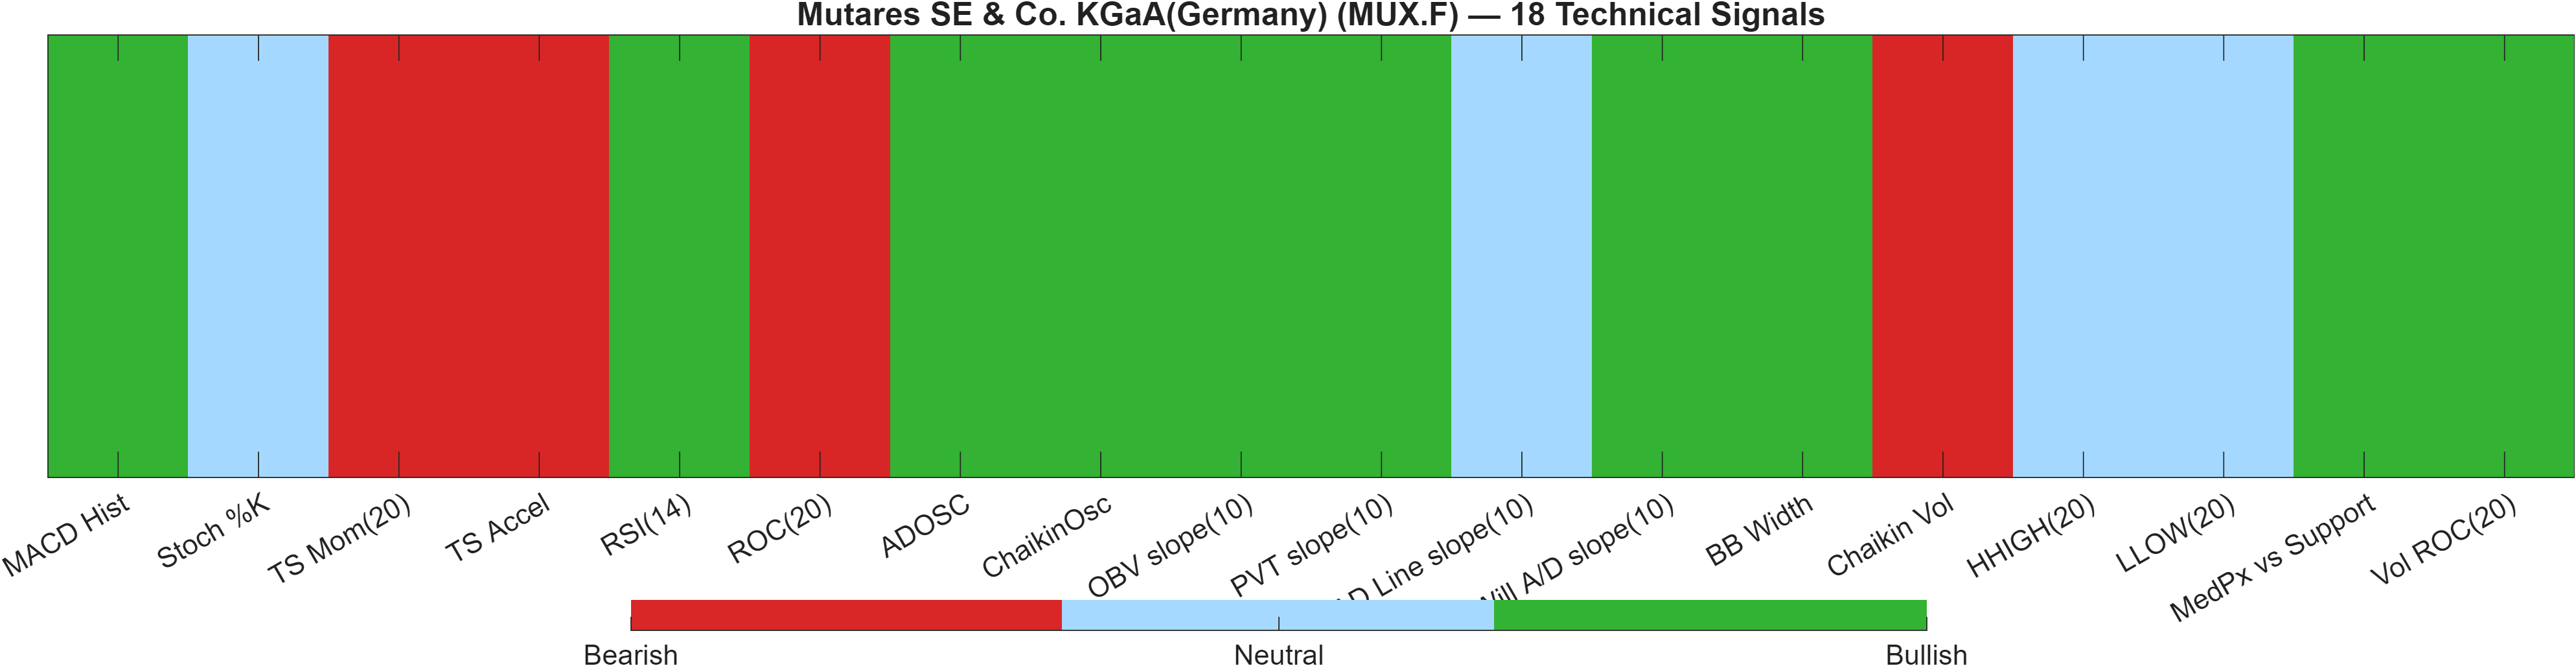
The technical stack is best described as confluence-positive but model-divergent. On one hand, the 18-signal confluence score is 0.333 (Bullish) with Bull 10 / Bear 4 / Neutral 4, suggesting a broad base of supportive indicator states. On the other hand, the Deep Reinforcement Learning (DRL) technical rank is #1185 with a Bearish label and score -0.663, pulling the blended output down to 0.034 (Neutral). This is a meaningful tension: breadth of signals can look constructive even while a ranking model penalizes the overall pattern versus the broader universe.
Looking only at a few high-information indicators clarifies the shape of the disagreement. Momentum/oscillator inputs show MACD Hist 0.05111 (Bullish) and RSI(14) 57.63 (Bullish), but trend-sensitivity measures are less supportive with TS Mom(20) -1.45 (Bearish) and ROC(20) -4.374 (Bearish). That mix is consistent with a market that is stabilizing but not yet accelerating—often a regime where ranking systems can remain cautious until follow-through appears.
Participation/volume signals are notably constructive: OBV slope(10) 1405, PVT slope(10) 5.615, and Vol ROC(20) 77.14 are all bullish. When these measures remain firm while price is consolidating, it can indicate that distribution pressure is not dominant. However, the presence of Chaikin Vol 133.6 (Bearish) introduces a volatility-of-flow warning: liquidity conditions may be uneven even if net flow measures are positive.
Netting these together, the blended neutral score (0.034) is a reasonable “wait for resolution” stance: the indicator base is not broadly bearish, yet the cross-sectional technical rank warns that the overall configuration is not currently strong relative to the full 1425-instrument universe.
Signal table (Bull/Bear/Neutral)
| Indicator | Value | Signal |
|---|---|---|
| MACD Hist | 0.05111 | Bullish |
| Stoch %K | 52.17 | Neutral |
| TS Mom(20) | -1.45 | Bearish |
| TS Accel | -0.1 | Bearish |
| RSI(14) | 57.63 | Bullish |
| ROC(20) | -4.374 | Bearish |
| ADOSC | 100 | Bullish |
| ChaikinOsc | 996.4 | Bullish |
| OBV slope(10) | 1405 | Bullish |
| PVT slope(10) | 5.615 | Bullish |
| AD Line slope(10) | — | Neutral |
| Will A/D slope(10) | 0.2 | Bullish |
| BB Width | 0.06757 | Bullish |
| Chaikin Vol | 133.6 | Bearish |
| HHIGH(20) | 33.15 | Neutral |
| LLOW(20) | 31.05 | Neutral |
| MedPx vs Support | 2.058 | Bullish |
| Vol ROC(20) | 77.14 | Bullish |
Interpretation: Indicator-level signals form the base confluence, which is then adjusted using a separate AI-driven technical ranking model. The final technical score summarizes this combined view.
6) News sentiment + extractive gist
Sentiment score (avg): 0.084 | Positive: 40% | Neutral: 60% | Negative: 0%
KGNAI AI News Sentiment Score (normalized -1 to +1): Not available (as of —) | Label: Not available | Overall news score: 0.08
Positive Developments
Recent coverage across major financial outlets indicates a generally constructive tone around Mutares SE & Co. KGaA, with commentary emphasizing periods of strong share-price performance and ongoing corporate activity. The sentiment mix supports this: 40% of the sampled items are positive and the average score is 0.084, which is modestly constructive without reading as euphoric. This profile is consistent with the broader analytic stack where longer-horizon KGNAI ranks remain strong (notably 6‑Monthly #20 and Yearly #17). From a market-structure perspective, constructive news flow can help sustain higher lows during consolidation, particularly when volatility remains compressed (Bollinger bandwidth 0.0676) and technical breadth leans positive (18-signal confluence 0.333). The key is whether incremental news flow coincides with a shift from stability into expansion above the identified resistance zone.
Neutral / Mixed Developments
The dominant share of coverage is neutral (60%), which fits a “monitoring” posture rather than a decisive catalyst regime. In this context, neutral articles often function as maintenance flow: they keep attention on the name but do not, by themselves, resolve the current technical split (Close vs MA50 = Bearish while MA50 vs MA200 = Bullish). This also aligns with the blended technical score of 0.034 (Neutral), where indicator confluence and the DRL technical model do not fully agree. With the KGNAI AI News Sentiment Score explicitly listed as Not available in the provided data, the actionable takeaway is to treat the available sentiment metrics (avg 0.084; 0% negative) as contextual bias rather than a primary trigger.
Negative / Risk Signals
The dataset shows 0% negative items, but “risk” is still present through what is absent: limited decisive negative coverage can coexist with technical fragility if price loses key levels. In a consolidation regime with compressed volatility (0.0676 bandwidth), downside risk often appears suddenly when support zones fail. That makes the 29.4667 support area the practical risk marker, especially given the intermediate ranks that are less supportive (Weekly #646, Monthly #1007). Another risk signal inside the technical dashboard is Chaikin Vol 133.6 (Bearish), suggesting uneven liquidity dynamics even while other flow metrics are positive. The combined message is not “bearish news,” but rather a need for level-based validation given the model divergence (DRL rank #1185 vs confluence 0.333).
- What to monitor next: Price behavior at 33.8500 (break/hold) alongside volume confirmation.
- What to monitor next: Any close below 29.4667 and whether volatility expands from the 0.0676 bandwidth regime.
- What to monitor next: Whether technical model divergence narrows (blended score 0.034 improving while DRL rank pressure eases from #1185).
Snapshot: AI Rank (Short–Mid–Long): Mixed (Neutral–Neutral–Bullish) · Technical Confluence: Bullish · Key Levels: Support ~29.47 | Resistance ~33.85 · News Sentiment: Neutral
Sources referenced: Reuters, Bloomberg, Yahoo Finance, MarketWatch, Investing.com
7) Sources
Not available in the provided data.
You may also like: How KGNAI AI ranks instruments across global markets
Disclaimer: KGNAI provides AI-generated analytics and educational market commentary only. This is not financial advice. Markets involve risk. Always do your own research.