
SAF.PA — Safran SA (France) on 27-Feb-2026: Neutral short-term, bullish mid-term signals, even near key levels
Safran SA (France) (SAF.PA) currently sits in a mixed regime where mid-term ranks are constructive while short- and long-horizon positioning remains more neutral. Within KGNAI’s 1425-instrument European universe, the weekly and monthly ranks are in the upper quartile (better relative positioning), whereas the daily and yearly ranks sit closer to the middle of the distribution. Technically, the setup is supported by moving-average structure (close vs MA50 bullish; MA50 vs MA200 bullish) and a positive momentum read via MACD histogram at 0.2901. At the same time, the risk of short-term compression is visible: Bollinger Bandwidth at 0.1835 and mixed volume/flow signals suggest that continuation would benefit from confirmation. Key decision zones remain well-defined with support ~296.3500 and resistance ~347.2500. News sentiment is skewed constructive on the latest KGNAI normalization, but the price response still needs to validate that bias around resistance.
- Short / Mid / Long rank stance: Neutral / Bullish / Neutral (daily #460; weekly #236; yearly #482 out of 1425).
- Technical confluence: Bullish (18-signal confluence 0.500; overall technical score 0.489).
- Key levels: Support ~296.3500; Resistance ~347.2500 (primary decision zones).
- News sentiment bias: Bullish on KGNAI normalized score (1.00 as of 2026-02-25), with avg sentiment score 0.125.
- Confirmation / invalidation: A break above 347.2500 with volume supports continuation; a close below 296.3500 increases deterioration risk.
KGNAI evaluates assets using large cross-sectional datasets built from millions of structured data points. Inputs incorporate fundamental metrics, technical structures, and systematically processed news sentiment. Statistical models, machine learning, and AI frameworks are used to assess relative positioning, signal alignment, and probabilistic behavior across broad universes.
- Ranks are comparative across the tracked universe, not absolute price targets.
- Confluence reflects alignment among independent signal groups.
- Support/resistance levels are probabilistic decision zones, not guarantees.
- Sentiment provides contextual bias within the broader analytical framework.
KGNAI Signal + Technical Snapshot + News Sentiment Digest
As of: 27-Feb-2026
Ticker: SAF.PA
1) KGNAI AI Analysis
Region: EUROPE
Total universe size: 1425 ranked instruments
- Daily rank: #460 out of 1425 — Neutral
- Weekly rank: #236 out of 1425 — Bullish
- Monthly rank: #179 out of 1425 — Bullish
- 3-Monthly rank: #125 out of 1425 — Bullish
- 6-Monthly rank: #920 out of 1425 — Neutral
- Yearly rank: #482 out of 1425 — Neutral
The rank stack shows a time-horizon divergence rather than a single, clean regime. The 3-month rank (#125) and monthly rank (#179) place SAF.PA in the stronger slice of the universe, consistent with a market that has rewarded the intermediate trend. In contrast, the 6-month rank (#920) is in the weaker portion of the distribution, suggesting the broader window remains less supportive and more sensitive to reversals when momentum cools.
This pattern often appears when an instrument has improved recently but still carries longer-horizon neutrality—the yearly rank (#482) and daily rank (#460) both cluster near the middle of the universe. That “middle-of-the-pack” short-term reading is consistent with a market that is not currently pricing a strong immediate edge, even if the mid-term structure remains favorable.
Term view: Short-term: Neutral. Mid-term: Bullish. Long-term: Neutral. Practically, that mix places greater weight on confirmation from price/volume behavior around the key zones highlighted later (support 296.3500, resistance 347.2500) rather than assuming the mid-term ranks will automatically dominate.
Want the full universe and complete rank tables? Unlock full access on KGNAI: https://www.kgnai.com/pricing
2) Price & trend overview
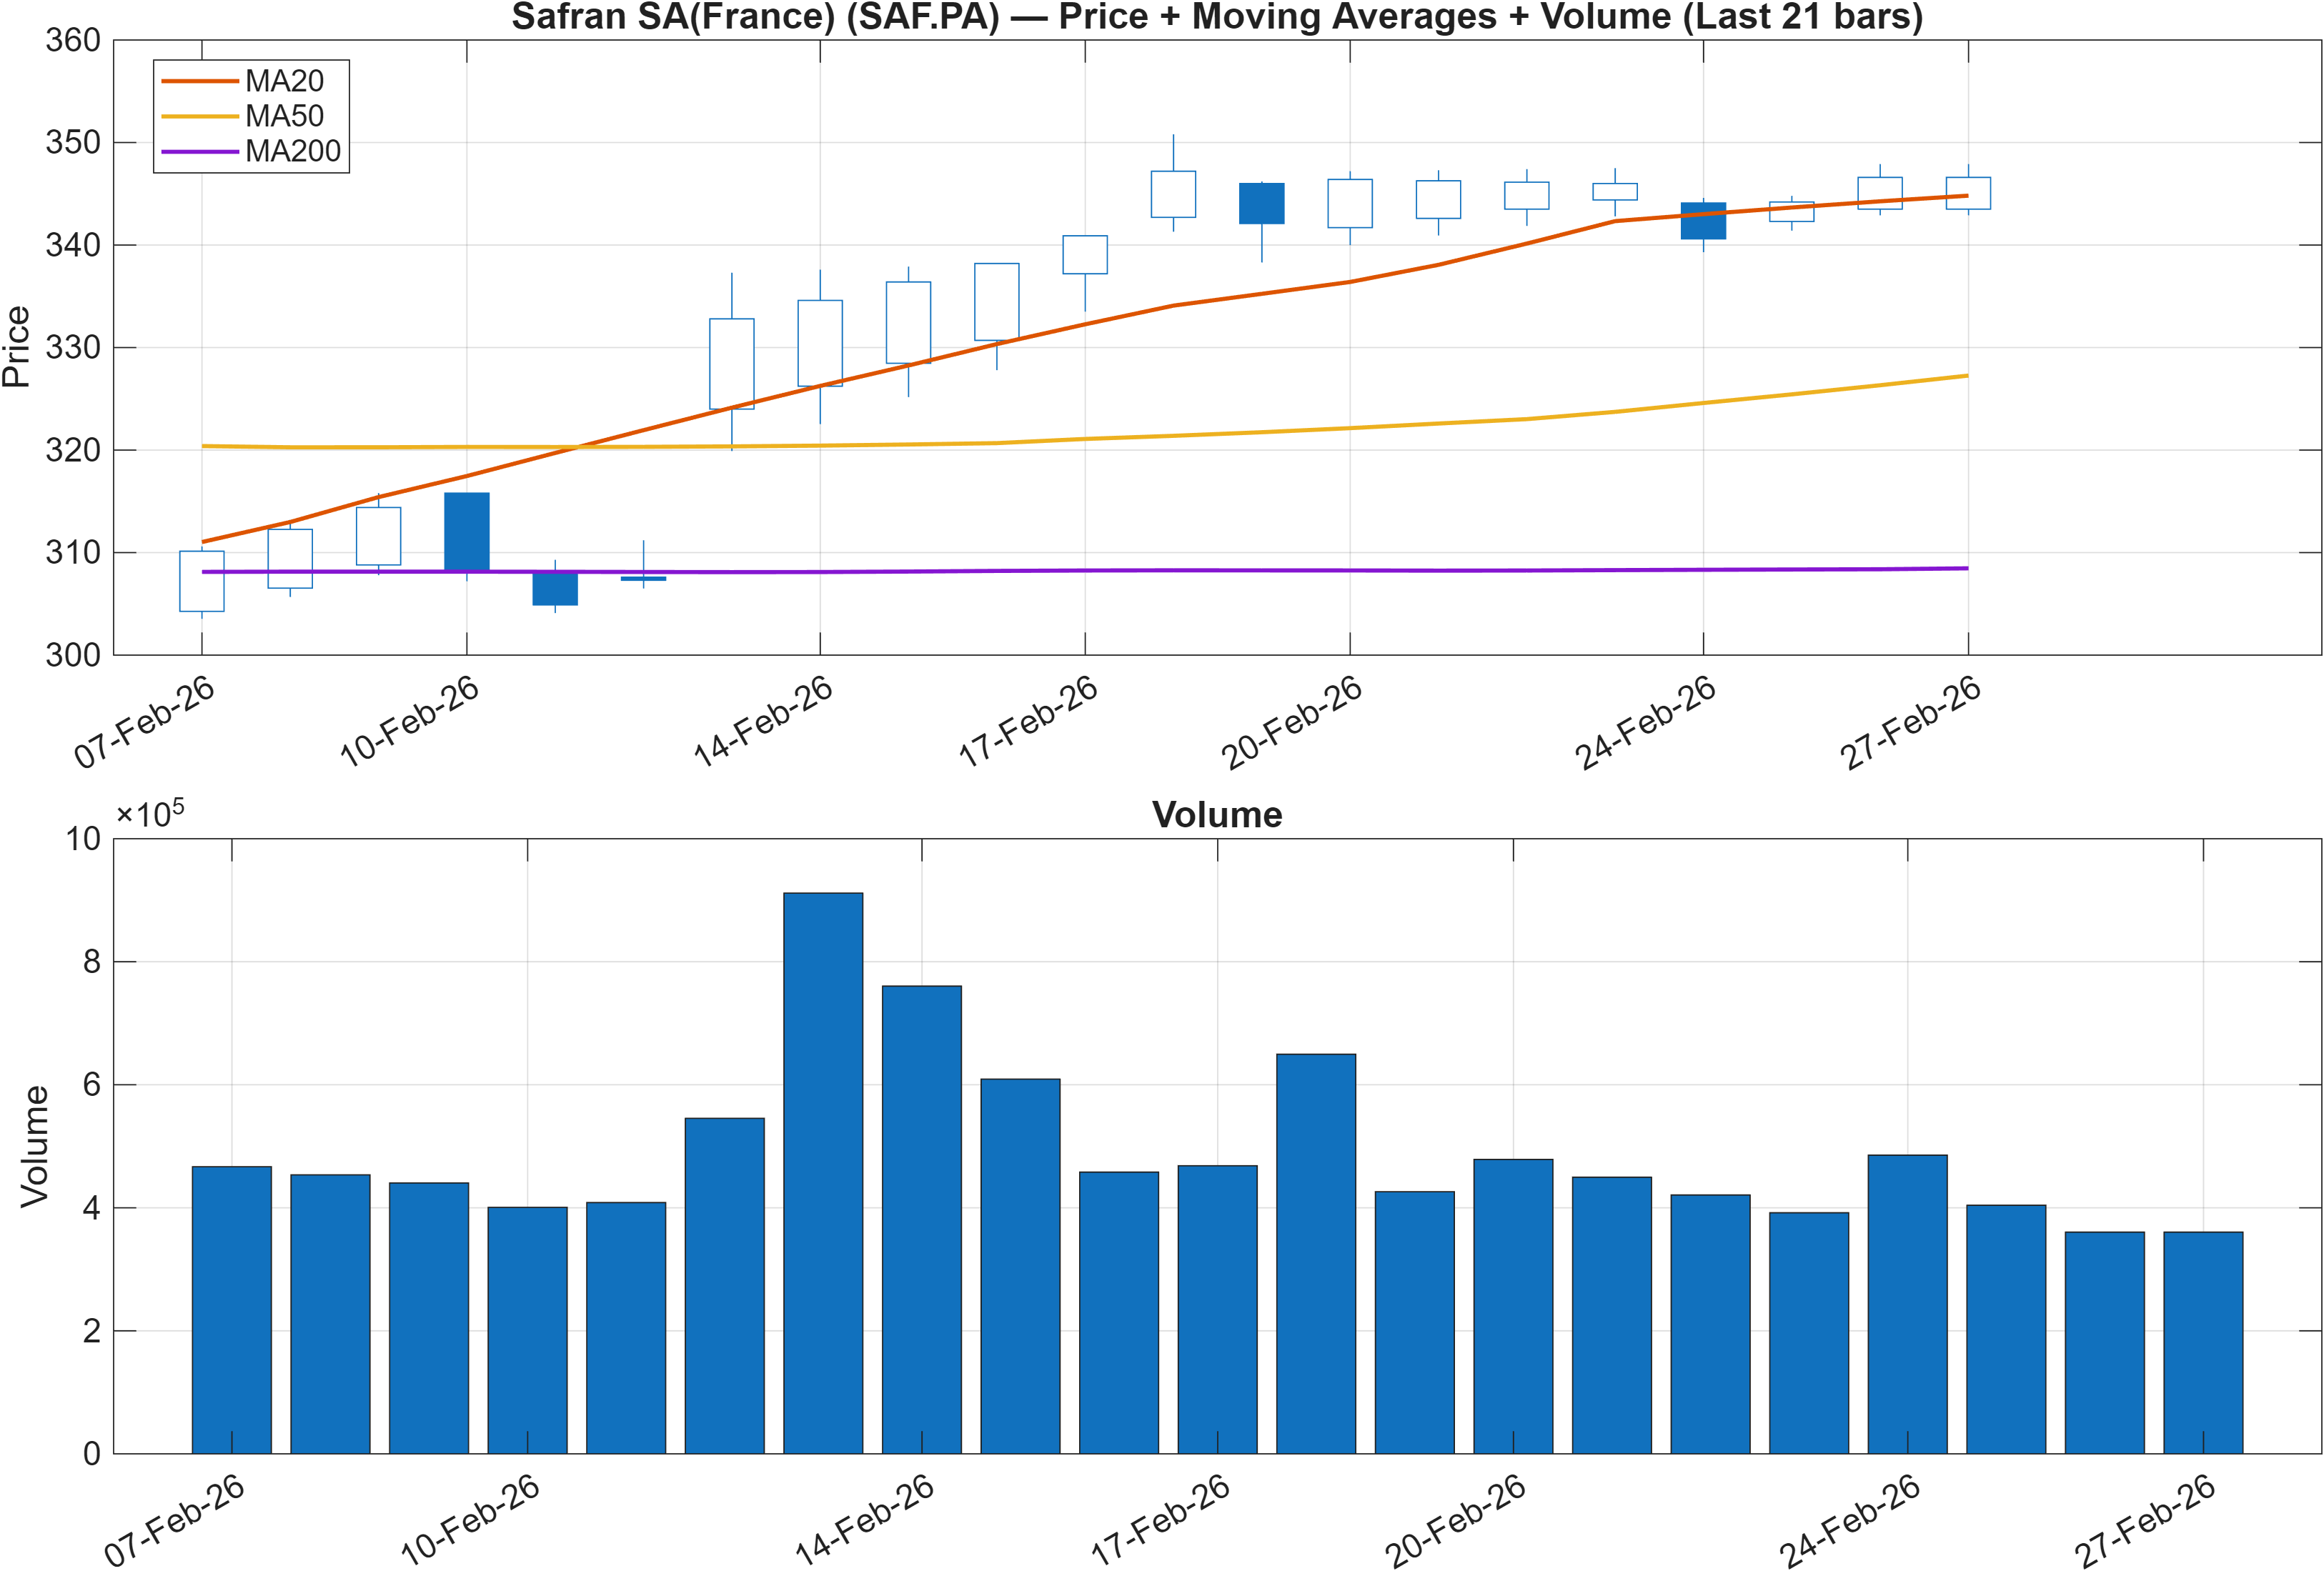
Trend structure is defined by a two-layer moving-average alignment: the close is above the MA50 (bullish), and the MA50 is above the MA200 (bullish). That combination typically represents a market still operating in a positive trend regime, where pullbacks more often act as tests of trend integrity rather than immediate regime shifts.
The key nuance is whether the trend is being reinforced or merely maintained. Later sections show a positive momentum signal (MACD histogram 0.2901) and an RSI that remains bullish (69.38), which can support trend persistence. However, trend-following strength can be undermined if confirmation from participation fades—particularly when volatility compresses (Bandwidth 0.1835) and volume change metrics lean negative (Vol ROC(20) -20.53).
From a market-structure perspective, the price is operating between clearly mapped decision zones: support ~296.3500 and resistance ~347.2500. With moving averages constructive, the burden of proof usually shifts to whether the market can convert resistance into acceptance. Failure to do so does not automatically negate the trend, but it increases the odds of a rotation back toward support before the next sustained leg is attempted.
Interpretation: Close vs MA50 = Bullish, MA50 vs MA200 = Bullish.
3) Momentum & volatility dashboard
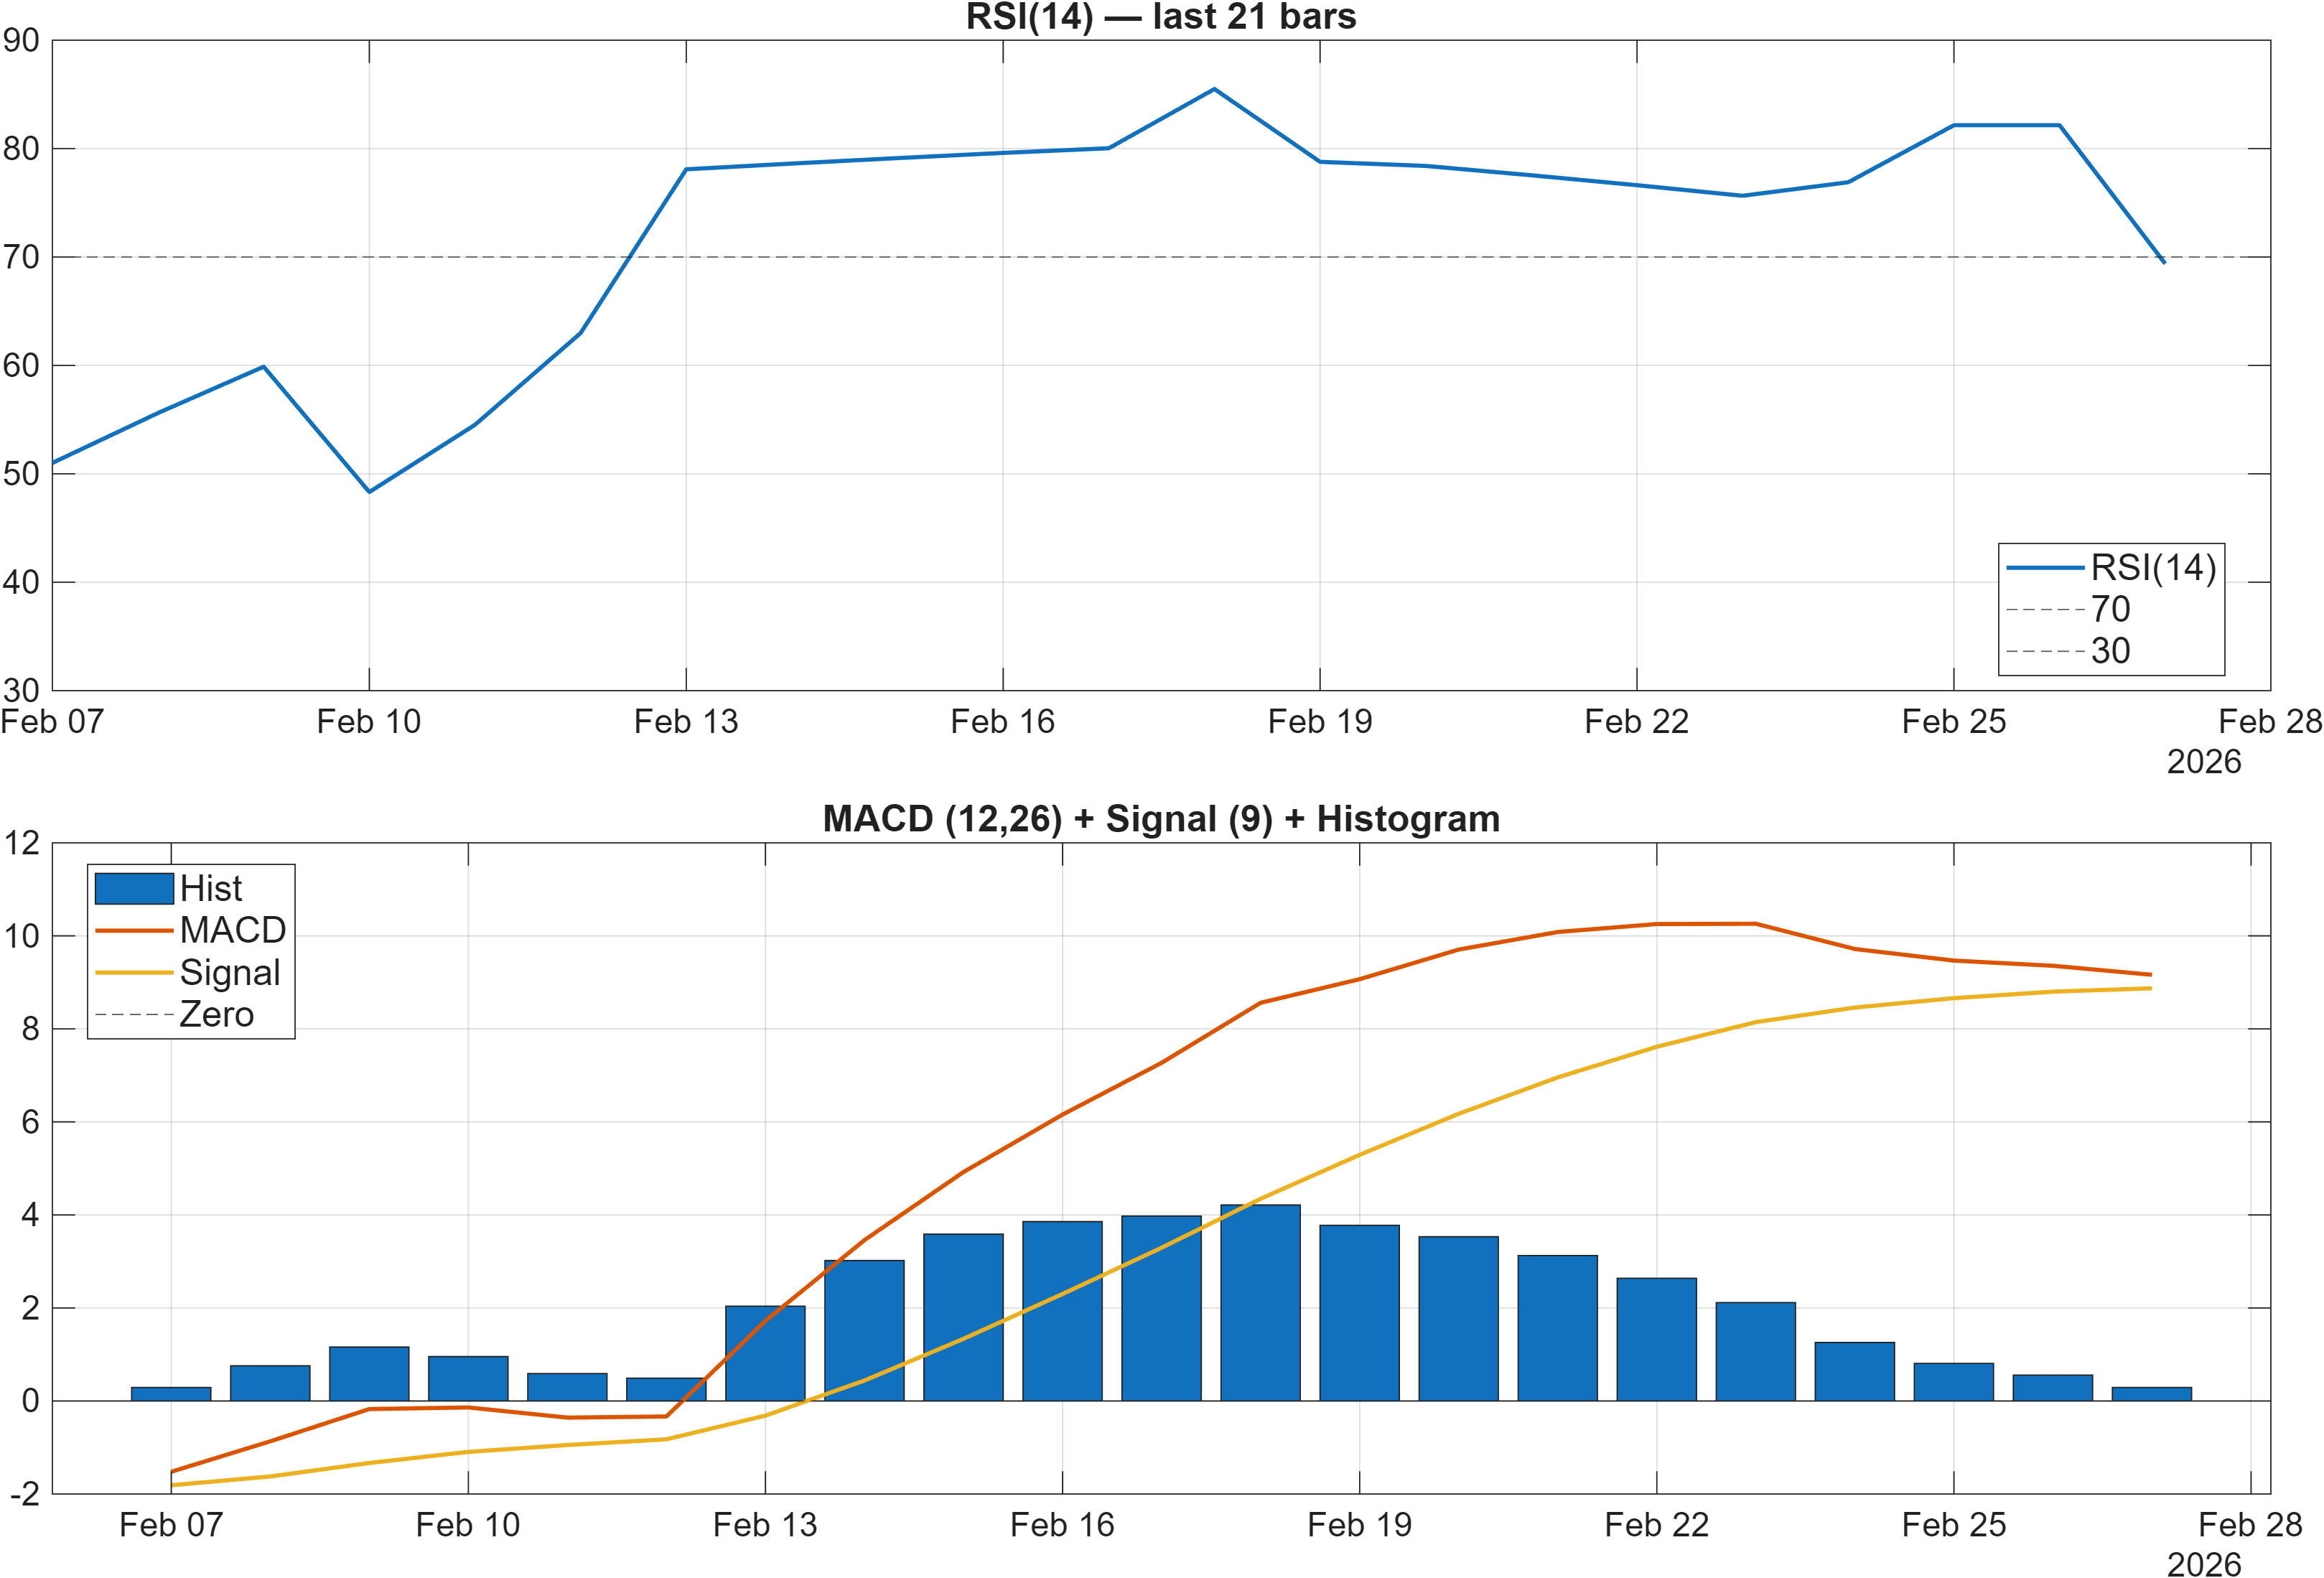
Momentum signals are broadly supportive but not uniform in what they imply about trend durability versus near-term saturation. The MACD histogram is positive at 0.2901, a configuration usually consistent with upward momentum still present. RSI(14) at 69.38 is labeled bullish, but it is also near the area where many instruments begin to exhibit incremental momentum fatigue even without a full reversal.
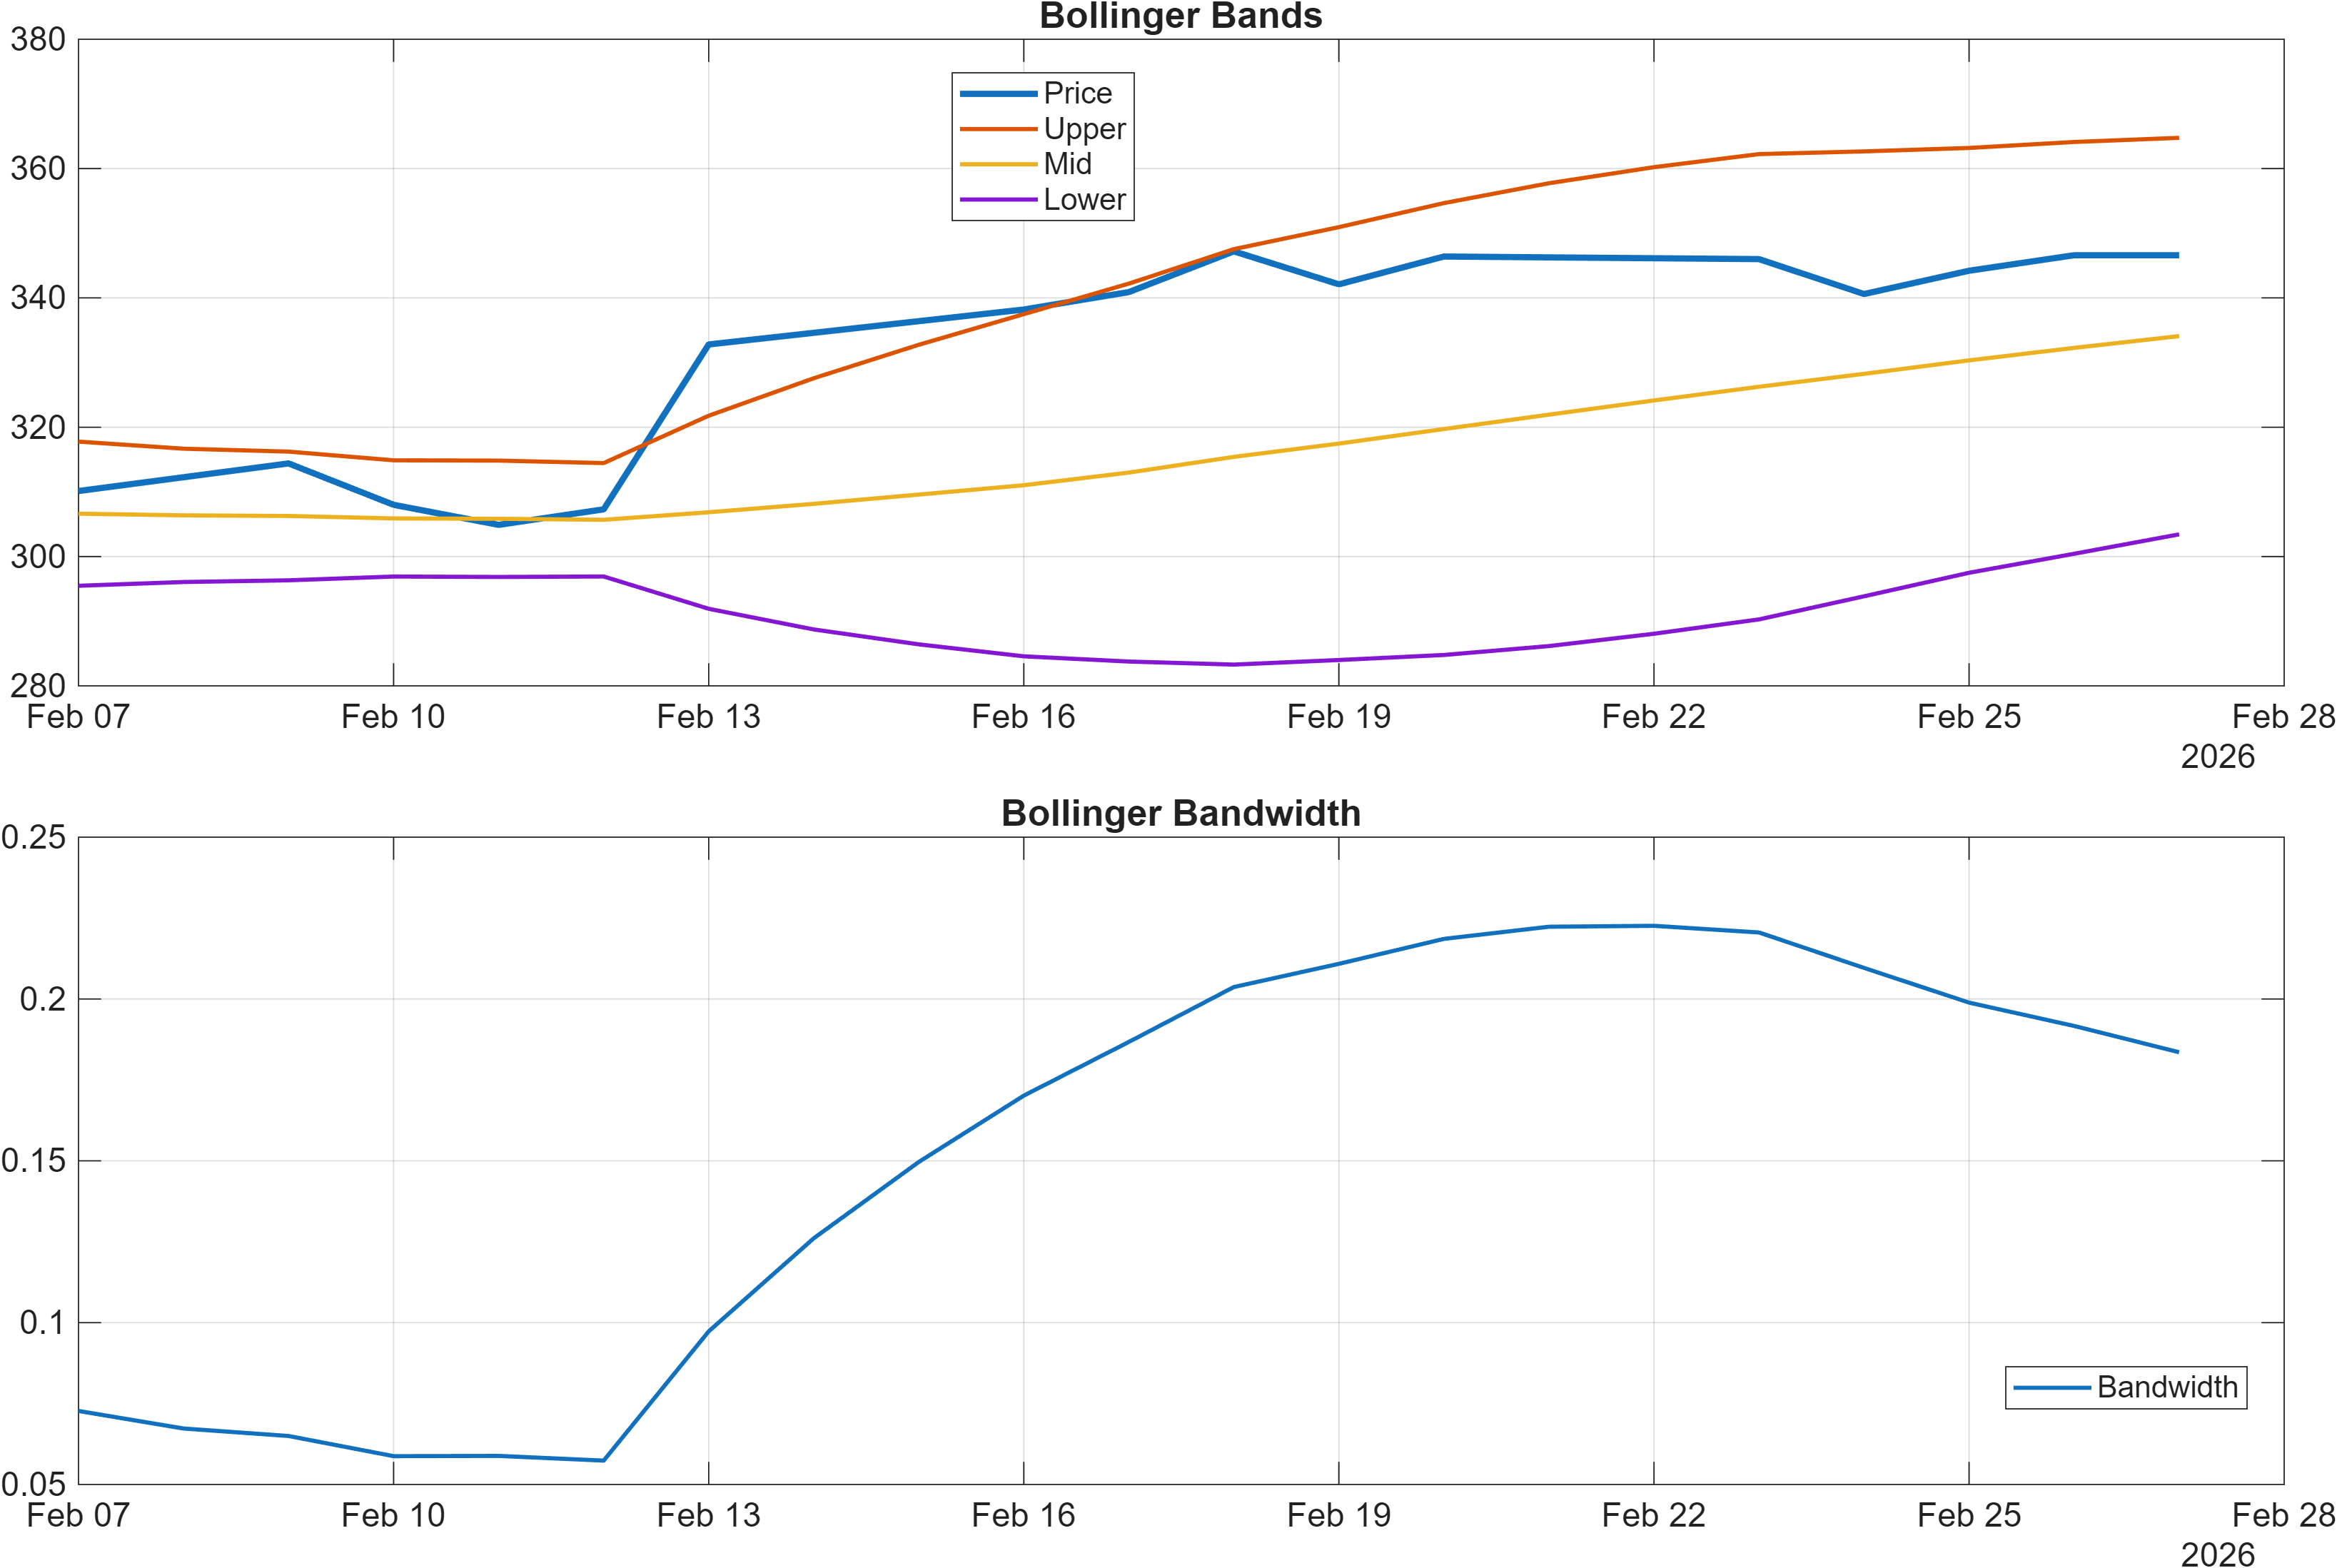
This is where volatility context matters. Bollinger Bandwidth at 0.1835 indicates a relatively contained volatility regime. In practice, bullish momentum inside a tighter volatility envelope can resolve two ways: a controlled continuation if demand remains consistent, or a sharper mean-reversion move if momentum stalls and liquidity thins.
The internal mix of momentum and flow metrics adds texture. TS Mom(20) at 34.33 and ROC(20) at 10.99 support the idea that recent price impulse has been positive. Yet participation is not uniformly confirming: Vol ROC(20) is -20.53, and later signal aggregation shows OBV slope(10) is bearish (-2.813e+05). That combination can still coexist with an uptrend, but it increases sensitivity to any failed push near resistance.
Interpretation: RSI bias = Bullish, MACD hist = 0.2901.
Interpretation: Bandwidth (volatility regime) latest = 0.1835.
4) Support / Resistance zones
Support ~ 296.3500 | Resistance ~ 347.2500
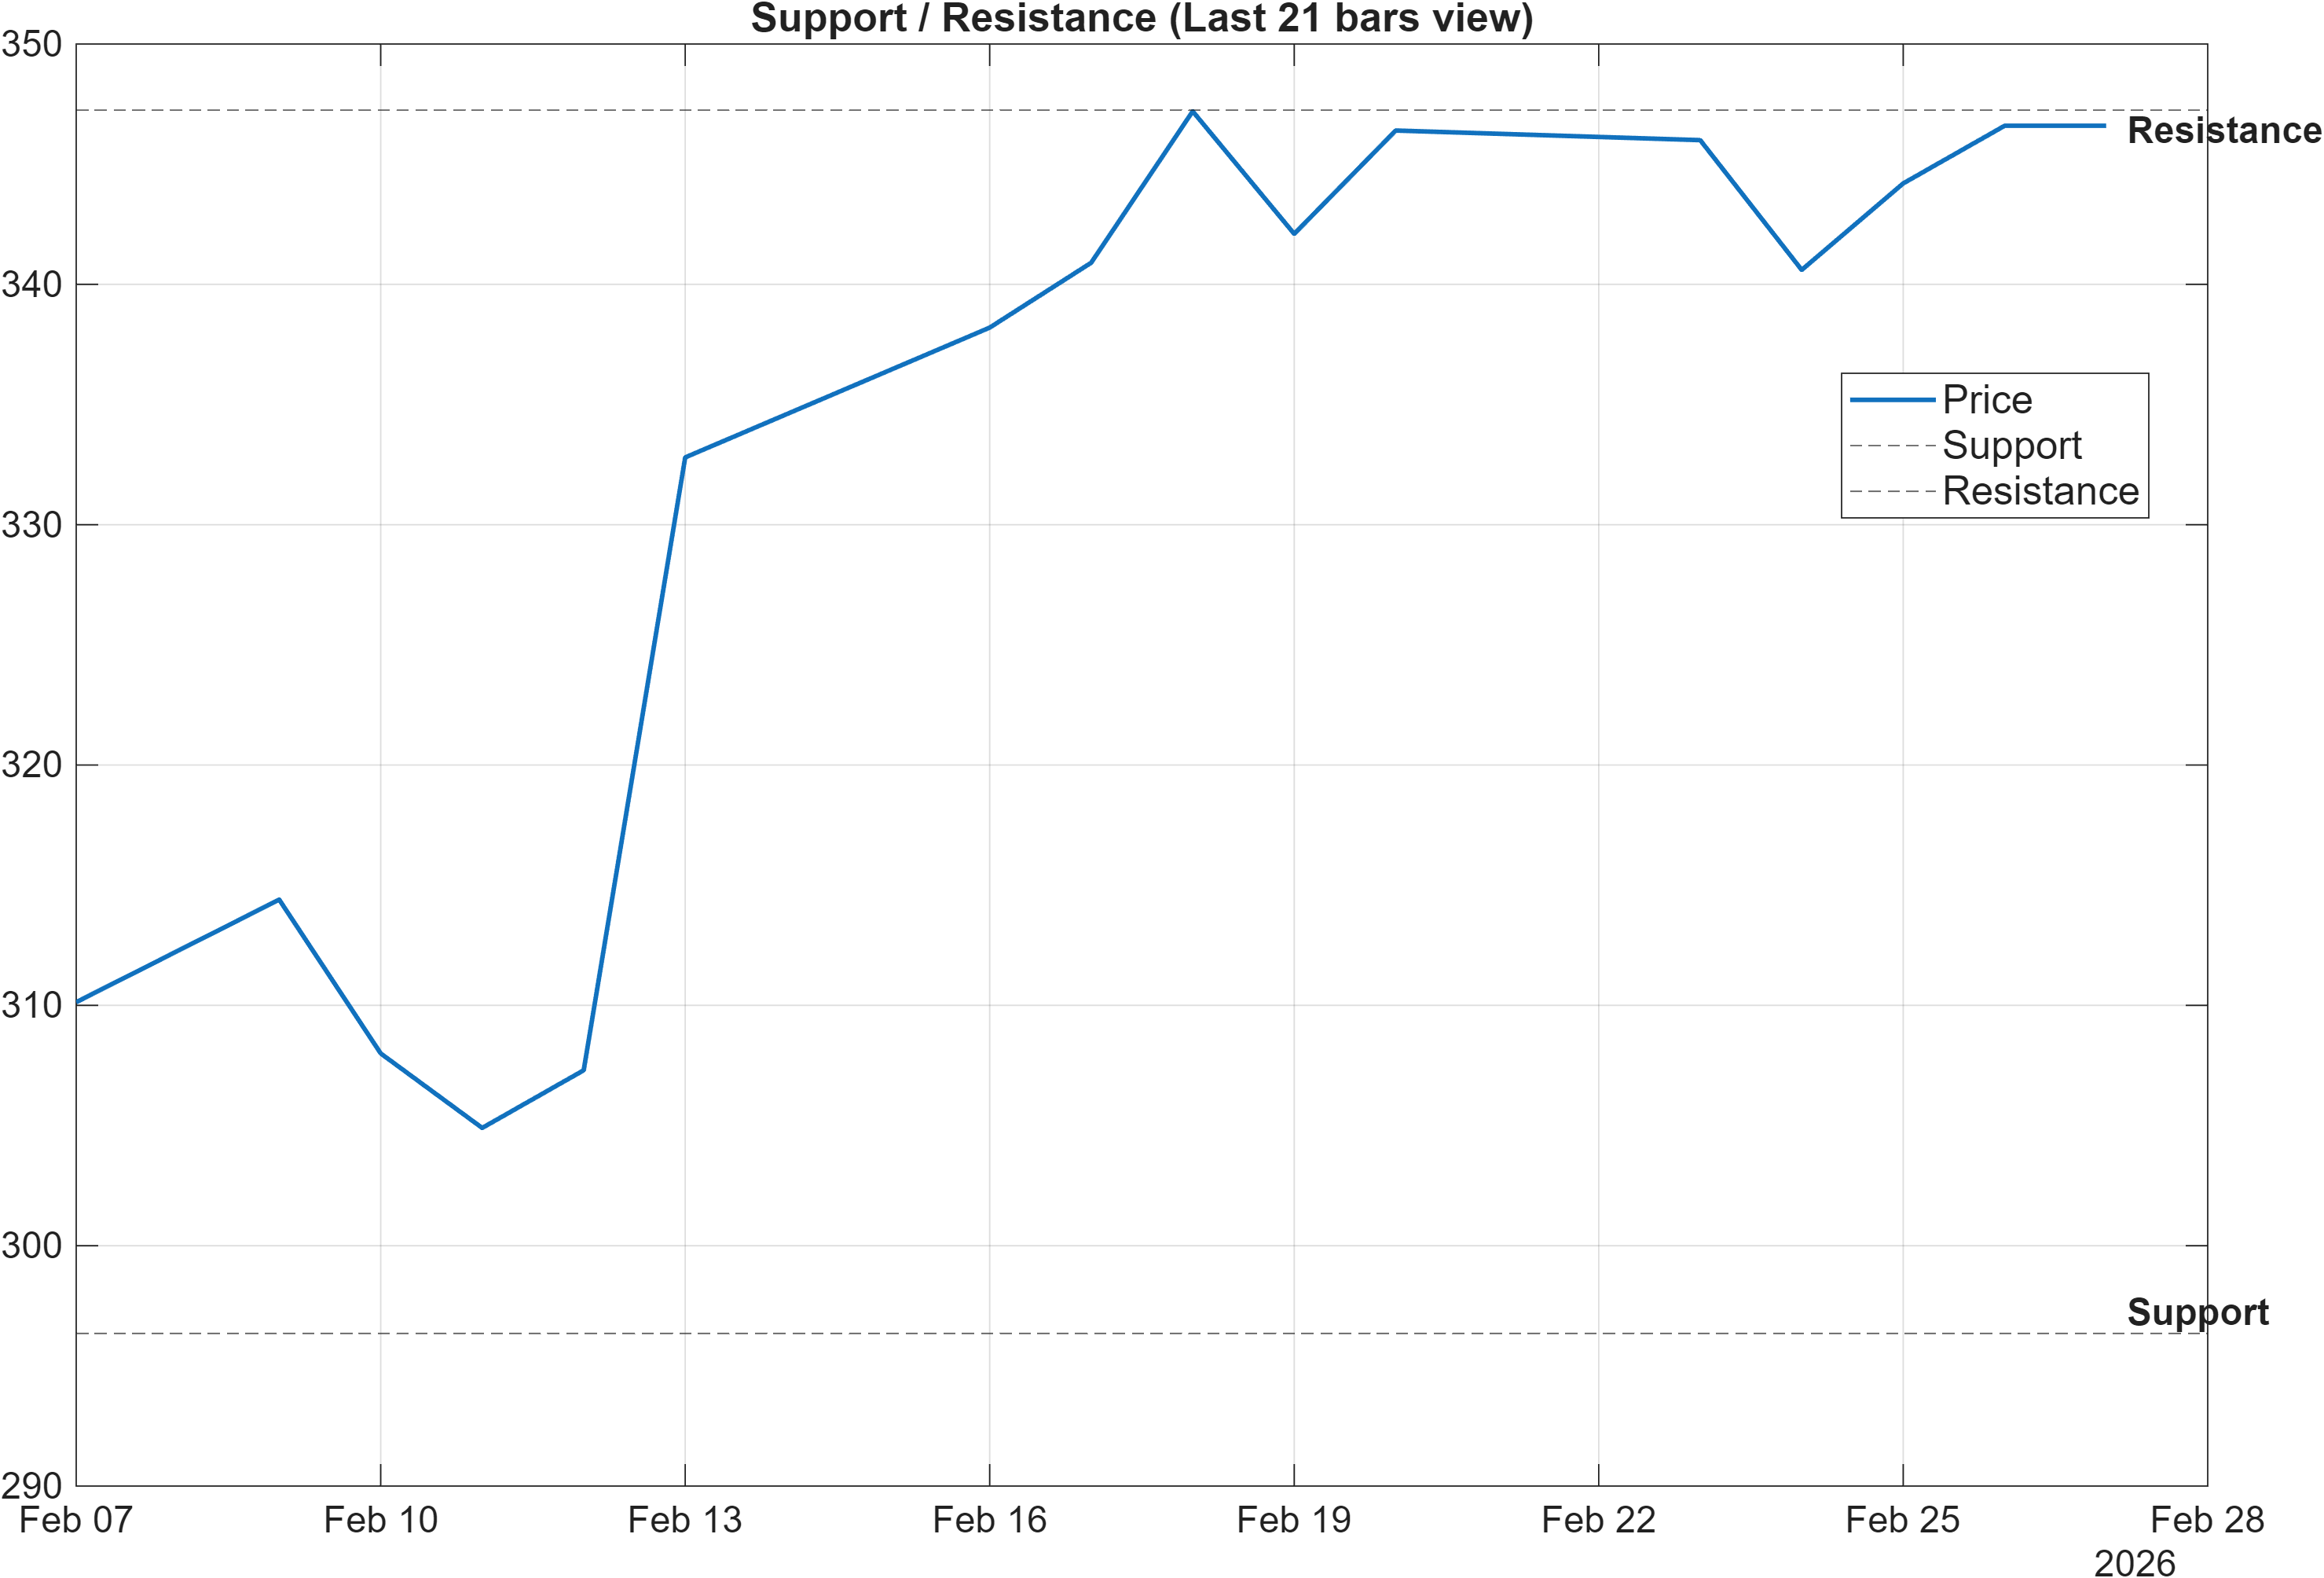
The current technical picture is best framed as a range of probabilistic decision zones rather than a single trigger. Resistance at 347.2500 is the primary level where a bullish trend must demonstrate acceptance. With RSI(14) already at 69.38 and volatility relatively contained (Bandwidth 0.1835), upside follow-through tends to benefit from confirmation via participation metrics rather than purely price-based momentum.
Support at 296.3500 acts as the principal downside reference for risk management and regime assessment. A move toward this zone would not necessarily break the longer moving-average structure immediately, but it would pressure the “mid-term bullish, short-term neutral” rank mix by forcing momentum and confluence readings to re-evaluate. In other words, the level is less about a single print and more about whether the market can maintain constructive behavior when tested.
Between these boundaries, additional context from the signal table suggests the market is not uniformly powered by volume (Vol ROC(20) -20.53) despite positive momentum (MACD histogram 0.2901). That asymmetry often produces cleaner outcomes when the breakout condition is strict: not merely touching resistance, but clearing it with sufficiently improved activity.
Scenario view: Break above resistance with volume → continuation. Close below support → signal deterioration risk.
5) Quant Technical Dashboard (18 Signals)
KGNAI AI Technical Analysis Score (Deep Reinforcement Learning): Rank #383 out of 1425 (Rank 1 represents the strongest technical positioning and a higher probability of favorable price behavior. As ranks increase toward the maximum, the probability of favorable outcomes weakens and bearish positioning becomes more dominant.) | Label: Neutral | Score: 0.462
18-Signal Technical Confluence Score: 0.500 (Bullish)
Overall Technical Score (18-signal confluence + DRL rank blend): 0.489 (Bullish)
Note: The blended score reflects signal strength weighted against broader AI technical ranking, which may temporarily diverge.
Blended technical score breakdown: 0.489 (Bullish | Bull 11 / Bear 2 / Neutral 5)
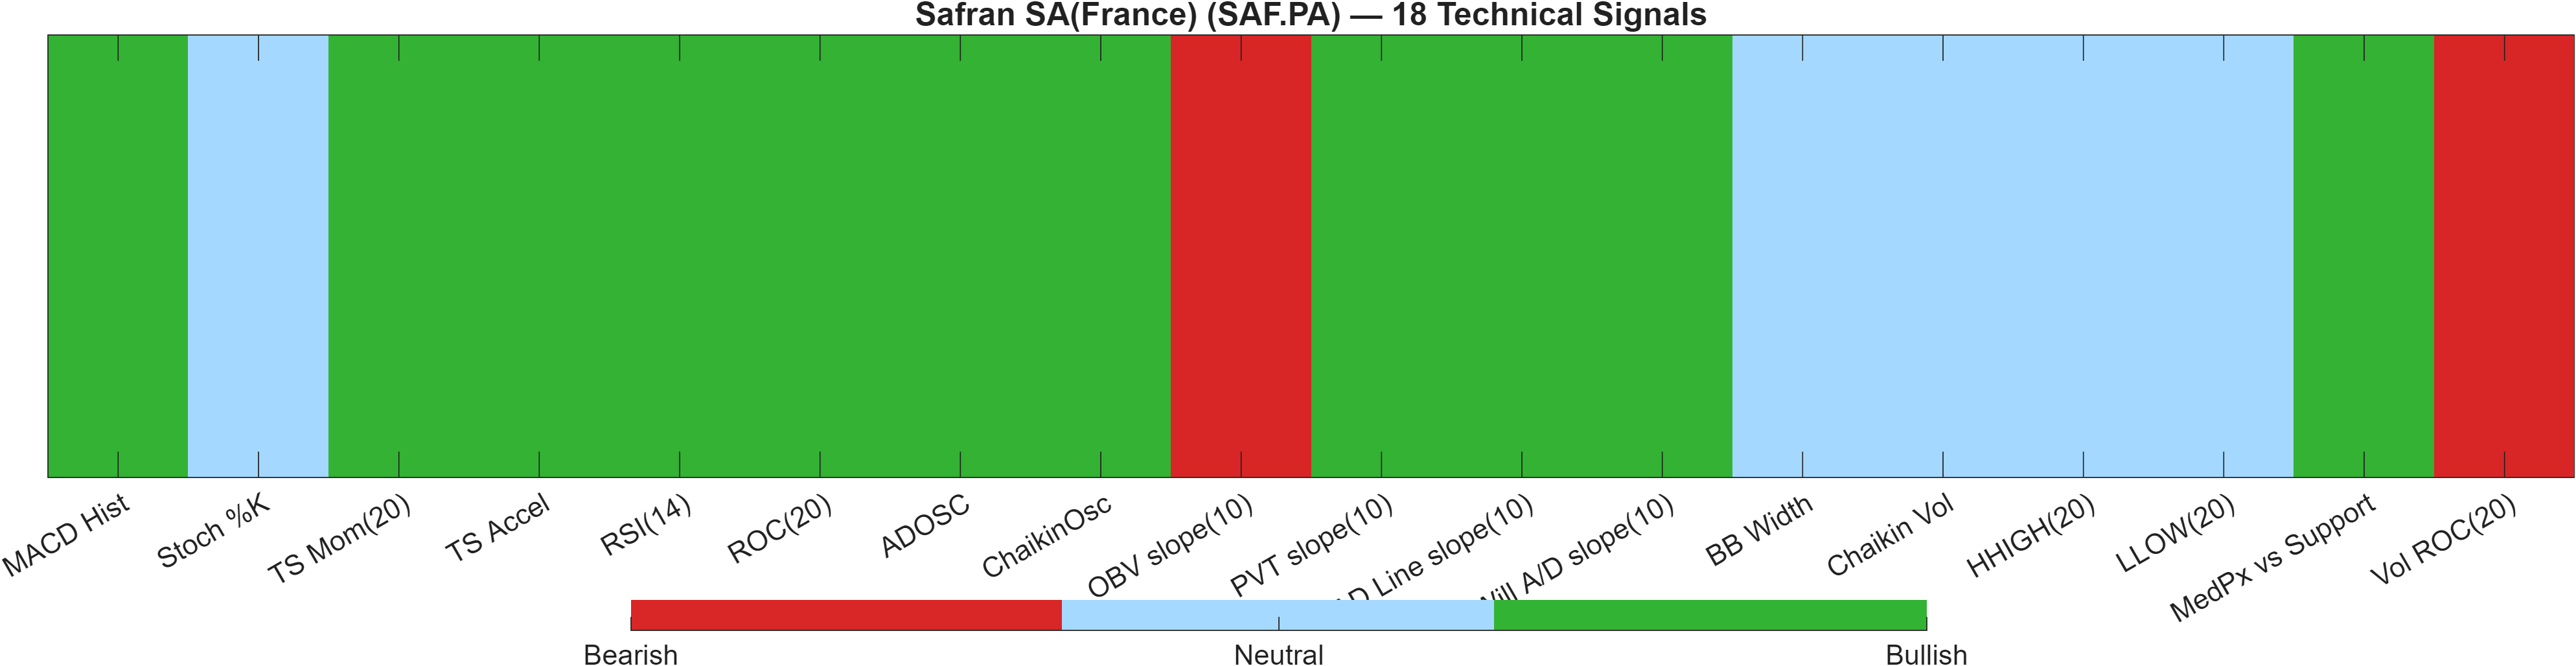
The dashboard highlights a measured bullish confluence rather than an extreme reading. The 18-signal confluence score is 0.500 (bullish) and the blended overall technical score is 0.489 (bullish). That said, the DRL technical rank is #383 with a neutral label and score 0.462, creating a useful tension: the indicator stack is constructive, while the broader AI ranking framework is less emphatic.
The composition of signals supports this “constructive but not unanimous” posture. Momentum and trend inputs are largely aligned (e.g., MACD histogram 0.2901; TS Mom(20) 34.33; RSI(14) 69.38), consistent with continuation conditions. However, the few bearish flags matter precisely because the overall setup is not extreme: OBV slope(10) is bearish at -2.813e+05, and Vol ROC(20) is bearish at -20.53. These can signal that price strength is being achieved with less uniform volume confirmation.
Neutral readings (including BB Width 0.1835 and Stoch %K 66.4) reinforce the idea that the market is not in a high-volatility chase phase; it is closer to an orderly trend that still requires validation at the boundary levels. In that context, the most analytically meaningful takeaway is not “bullish versus bearish,” but whether the bullish majority (Bull 11) can remain intact as the instrument interacts with 347.2500.
Signal table (Bull/Bear/Neutral)
| Indicator | Value | Signal |
|---|---|---|
| MACD Hist | 0.2901 | Bullish |
| Stoch %K | 66.4 | Neutral |
| TS Mom(20) | 34.33 | Bullish |
| TS Accel | 38.37 | Bullish |
| RSI(14) | 69.38 | Bullish |
| ROC(20) | 10.99 | Bullish |
| ADOSC | 81 | Bullish |
| ChaikinOsc | 5.857e+05 | Bullish |
| OBV slope(10) | -2.813e+05 | Bearish |
| PVT slope(10) | 1.048e+04 | Bullish |
| AD Line slope(10) | 1.547e+06 | Bullish |
| Will A/D slope(10) | 5.7 | Bullish |
| BB Width | 0.1835 | Neutral |
| Chaikin Vol | -39.29 | Neutral |
| HHIGH(20) | 350.8 | Neutral |
| LLOW(20) | 304.1 | Neutral |
| MedPx vs Support | 49.05 | Bullish |
| Vol ROC(20) | -20.53 | Bearish |
Interpretation: Indicator-level signals form the base confluence, which is then adjusted using a separate AI-driven technical ranking model. The final technical score summarizes this combined view.
6) News sentiment + extractive gist
Sentiment score (avg): 0.125 | Positive: 60% | Neutral: 40% | Negative: 0%
KGNAI AI News Sentiment Score (normalized -1 to +1): 1.00 (as of 2026-02-25) | Label: Bullish | Overall news score: 0.93
Positive Developments
Recent coverage across major financial outlets indicates a constructive narrative skew for Safran, consistent with the data readout showing 60% positive and 0% negative items in the provided sentiment breakdown. The common thread is attention around valuation framing following strong multi-year price behavior and ongoing market interest in how the current share price relates to underlying business positioning. In parallel, commentary referencing digital and maintenance-oriented initiatives is generally treated as supportive context for operating execution and aftermarket positioning. From a market-signal perspective, the key interaction is whether this positive informational backdrop can translate into confirmed participation at technical inflection points—particularly as the broader technical picture is bullish but not unanimous (overall technical score 0.489 with some volume-related bearish flags).
Neutral / Mixed Developments
A meaningful portion of the news flow reads as informational or comparative, aligning with the 40% neutral share in the sentiment mix and an average sentiment score of 0.125 (slightly positive, not extreme). These items tend to revisit recent share price momentum and ask whether valuation remains aligned—language that can coincide with either continuation or digestion phases. For the tape, this type of coverage often maps to a “wait for confirmation” posture: momentum indicators such as MACD histogram 0.2901 and RSI(14) 69.38 remain constructive, but the market may still require clearer evidence at resistance rather than responding to narrative alone.
Negative / Risk Signals
Even with 0% negative in the provided sentiment split, risk framing still emerges indirectly through repeated discussion of whether strong prior performance is already priced in. That is less a fundamental claim than a positioning and expectations issue, which can matter most when price approaches mapped decision levels. With resistance at 347.2500 and volatility relatively contained (Bandwidth 0.1835), the key risk is that upbeat coverage fails to produce incremental demand, especially given the presence of bearish participation signals (e.g., Vol ROC(20) -20.53 and OBV slope(10) -2.813e+05). In such settings, adverse outcomes typically arise from failed break attempts and subsequent mean reversion, rather than from a single negative catalyst in the headlines.
- Whether price acceptance improves above 347.2500 alongside stronger participation, given Vol ROC(20) is -20.53.
- Whether momentum stays constructive (MACD histogram 0.2901) as RSI(14) remains elevated at 69.38.
- Whether pullbacks hold above 296.3500, preserving the mid-term bullish rank posture (weekly #236; monthly #179).
Snapshot: AI Rank (Short–Mid–Long): Mixed (Neutral–Bullish–Neutral) · Technical Confluence: Bullish · Key Levels: Support ~296.35 | Resistance ~347.25 · News Sentiment: Neutral
Sources referenced: Reuters, Bloomberg, Yahoo Finance, MarketWatch, Investing.com
7) Sources
Not available in the provided data.
You may also like: How KGNAI AI ranks instruments across global markets
Disclaimer: KGNAI provides AI-generated analytics and educational market commentary only. This is not financial advice. Markets involve risk. Always do your own research.