
PGE.WAR — PGE Polska Grupa Energetyczna SA(Poland) on 13-May-2026: Bearish Ranks with Mixed Technical Confluence
PGE Polska Grupa Energetyczna SA(Poland) (PGE.WAR) sits in a weak relative position versus the broader EUROPE universe, with most ranking horizons clustered toward the weaker end of the 1418-instrument distribution. At the same time, the technical picture is not uniformly negative: the blended technical score is 0.312 (Bullish) despite an 18-signal confluence of 0.167 (Neutral), highlighting a gap between broader positioning and select indicator groups. Momentum readings remain cautious—RSI bias is Neutral and MACD histogram is -0.0088—while volatility conditions appear contained with Bollinger bandwidth at 0.0607. From a market-structure standpoint, the immediate decision area is framed by support ~9.4060 and resistance ~11.2700, where follow-through and volume confirmation become more informative than single prints.
Key Takeaways
- Short / Mid / Long rank stance: Bearish / Bearish / Bearish (ranks concentrated in the weaker tail of the 1418-name universe).
- Technical confluence label: Neutral (18-signal confluence 0.167) with a Bullish blended score (0.312).
- Key levels: Support ~9.4060 | Resistance ~11.2700.
- News sentiment bias: Neutral (avg 0.000; 88% neutral, 6% positive, 6% negative).
- Confirmation / invalidation: A volume-backed move above 11.2700 would improve continuation odds; a close below 9.4060 increases deterioration risk.
What KGNAI Measures
KGNAI evaluates assets using large cross-sectional datasets built from millions of structured data points. Inputs incorporate fundamental metrics, technical structures, and systematically processed news sentiment. Statistical models, machine learning, and AI frameworks are used to assess relative positioning, signal alignment, and probabilistic behavior across broad universes.
How to Read This Report
- Ranks are comparative across the tracked universe, not absolute price targets.
- Confluence reflects alignment among independent signal groups.
- Support/resistance levels are probabilistic decision zones, not guarantees.
- Sentiment provides contextual bias within the broader analytical framework.
1) KGNAI AI Analysis
Region: EUROPE
Total universe size: 1418 ranked instruments
- Daily rank: #1253 out of 1418 — Bearish
- Weekly rank: #1351 out of 1418 — Bearish
- Monthly rank: #1113 out of 1418 — Neutral
- 3-Monthly rank: #1305 out of 1418 — Bearish
- 6-Monthly rank: #1293 out of 1418 — Bearish
- Yearly rank: #1292 out of 1418 — Bearish
The rank stack is notably asymmetric: the daily (#1253) and weekly (#1351) readings sit deep in the weaker portion of the distribution, while the monthly (#1113) is comparatively less negative (Neutral). This pattern often reflects a market that is failing to stabilize on shorter horizons even if the medium window is not as uniformly weak. The longer windows remain heavy—3-month (#1305), 6-month (#1293), and yearly (#1292) are all Bearish—suggesting that relative pressure has been persistent rather than episodic.
In regime terms, this is more consistent with a continuation of weak relative behavior than a clean transition, because improvement is not yet showing up in the weekly rank. For cross-sectional investors, the key inference is not directionality but positioning quality versus the universe: PGE.WAR is currently ranked closer to the weaker tail than the median on most horizons, which can matter for pair selection, hedged allocation, and risk budgeting.
The report’s stated term view aligns with the rank map: Short-term: Bearish, Mid-term: Bearish, Long-term: Bearish. Any subsequent stabilization would typically require the short-horizon ranks to improve first (daily/weekly), then propagate into the multi-month windows, rather than the reverse.
2) Price & trend overview
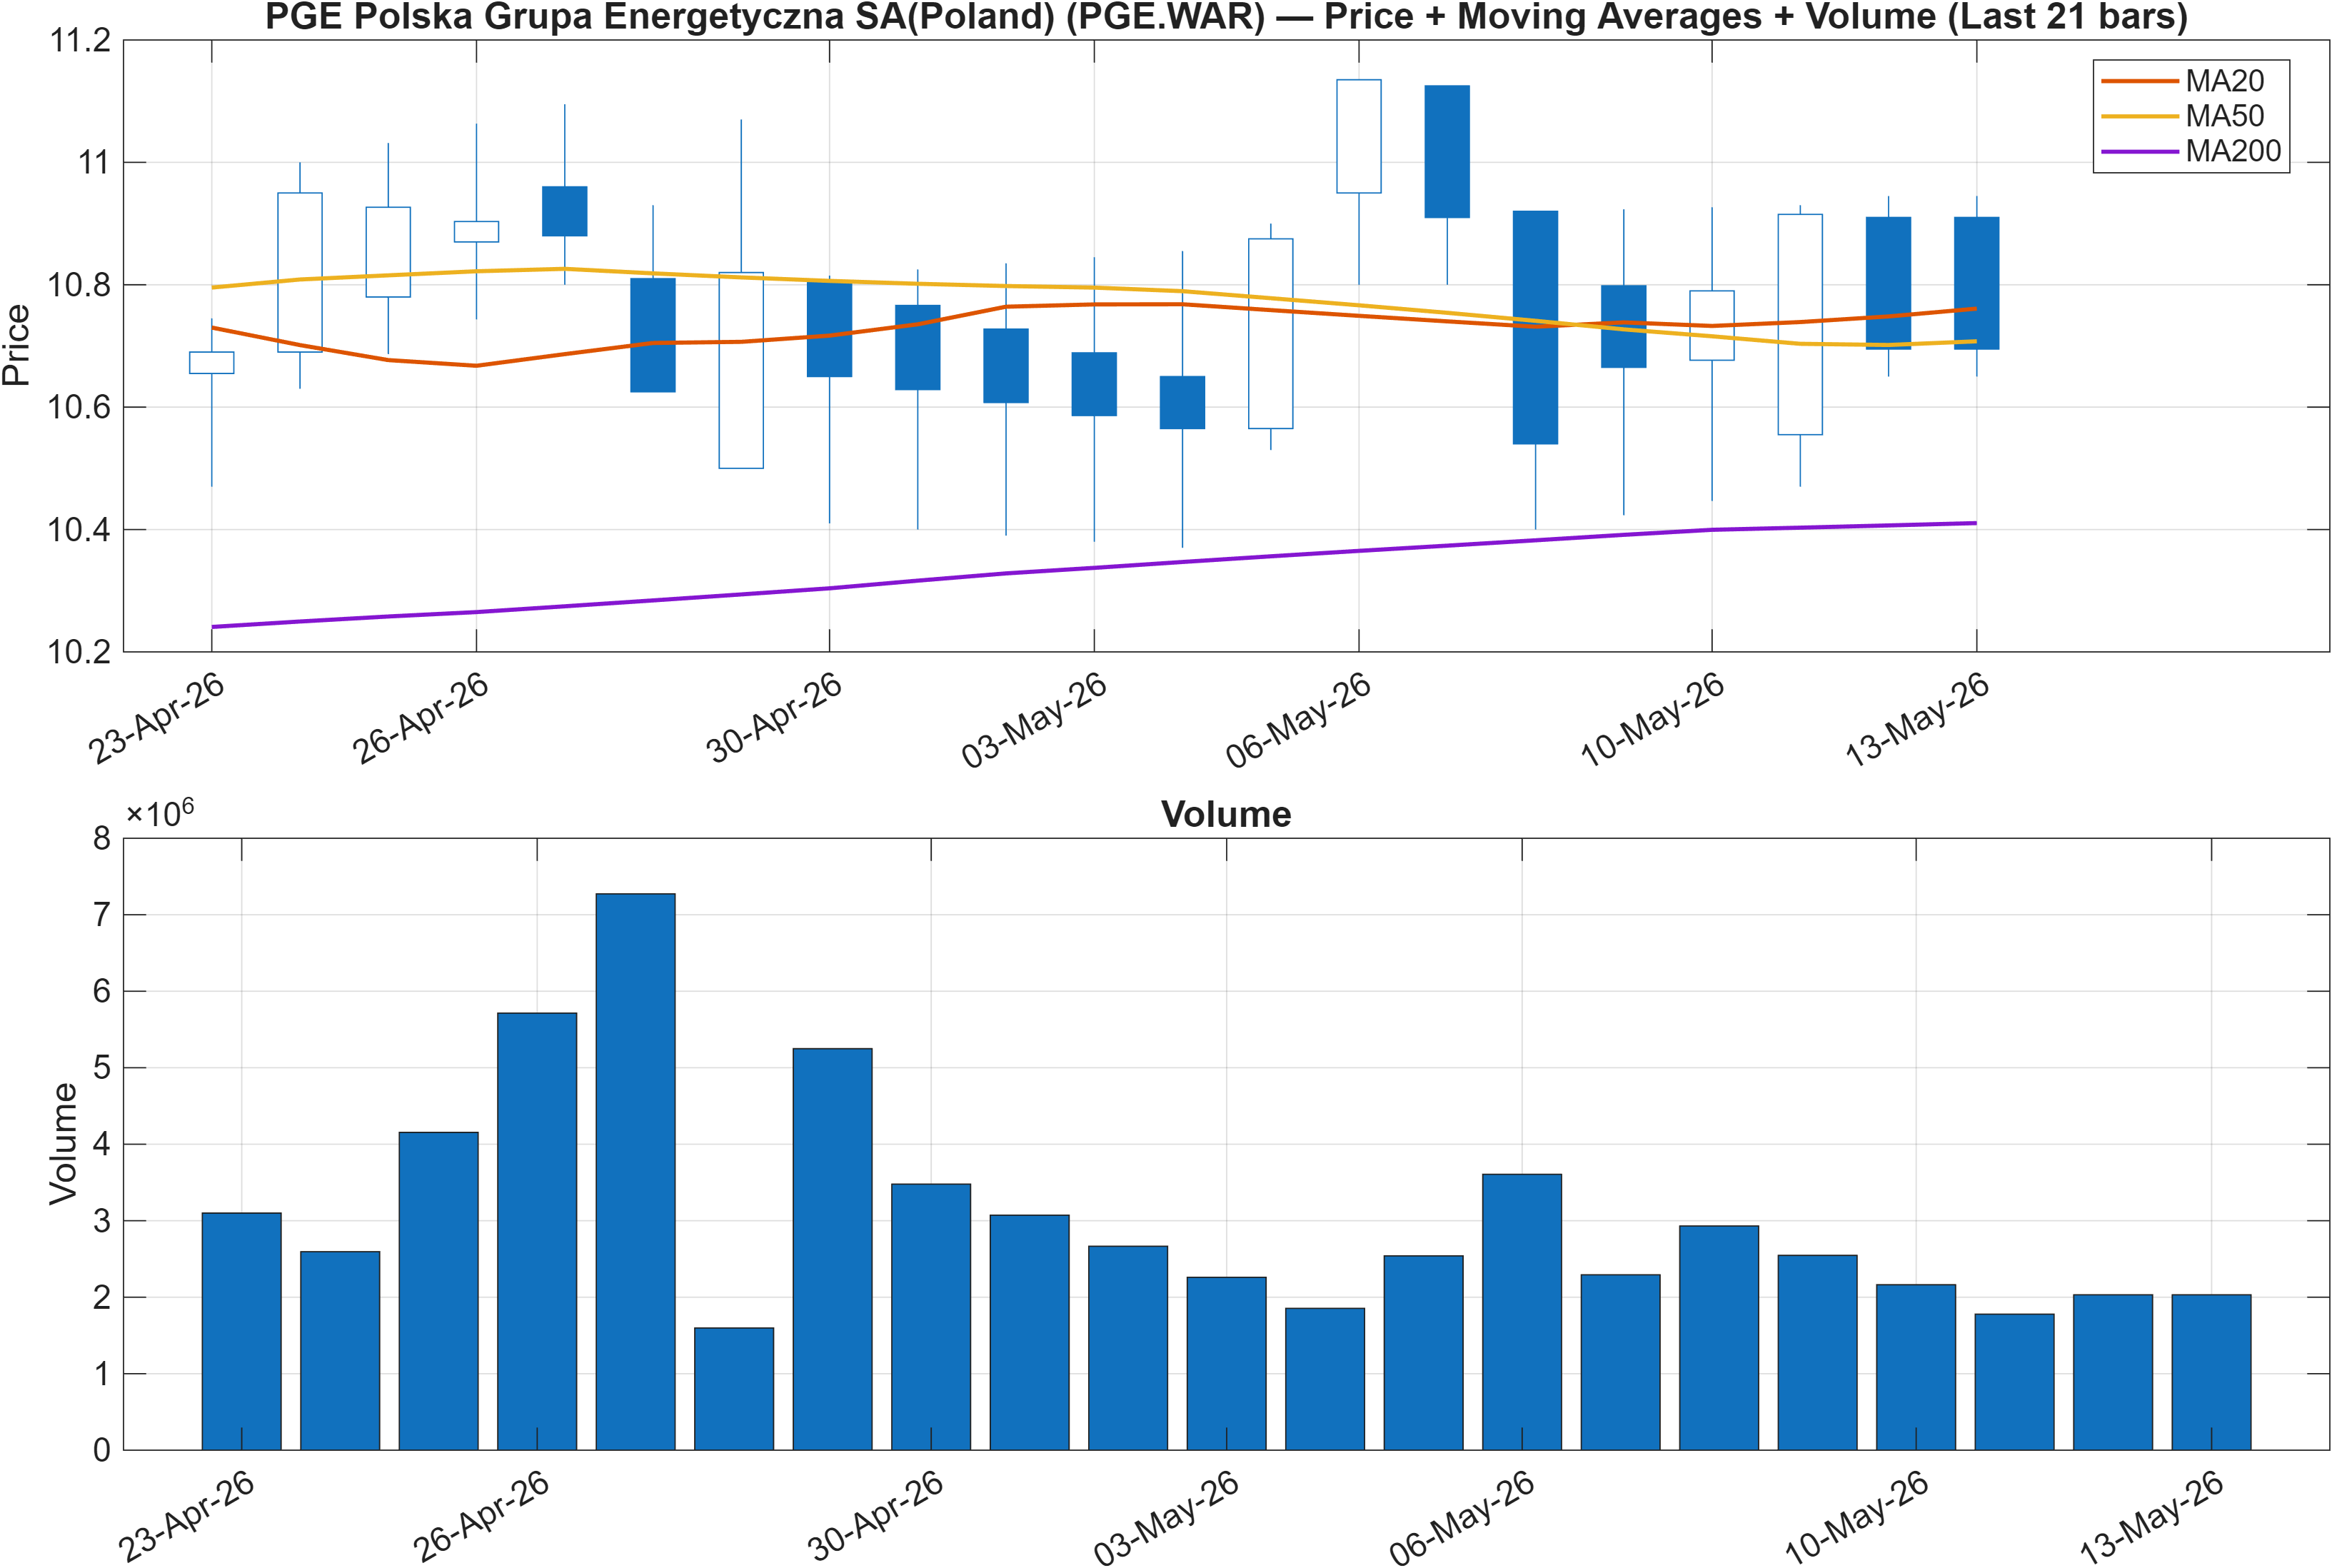
Interpretation: Close vs MA50 = Bearish, MA50 vs MA200 = Bullish.
Trend alignment vs. timeframe conflict
The trend read is defined by a familiar conflict: price is below the MA50 (Bearish), while MA50 remains above MA200 (Bullish). This configuration often appears when a prior uptrend has not fully broken down structurally, but the near-term tape is soft and trading below intermediate trend control. In practice, it places emphasis on whether the market is undergoing a pullback within an older regime or rotating into a deeper trend reset.
In that context, the rank profile adds weight to the downside risk of continuation: the weekly rank (#1351) being weaker than the monthly rank (#1113) suggests that selling pressure (or lack of relative demand) is more acute in the recent window than what the intermediate horizon alone would imply. The immediate structure is therefore better interpreted as trend fragility rather than a clean bullish continuation.
Volume, while not numerically specified in the provided data beyond the chart, is still central to the reading: the scenario framework later in the report explicitly ties meaningful continuation to a break above 11.2700 “with volume,” implying that trend validation is conditional, not assumed. Until then, the market remains in a state where mean-reversion rallies can occur without changing the larger rank-based assessment.
3) Momentum & volatility dashboard
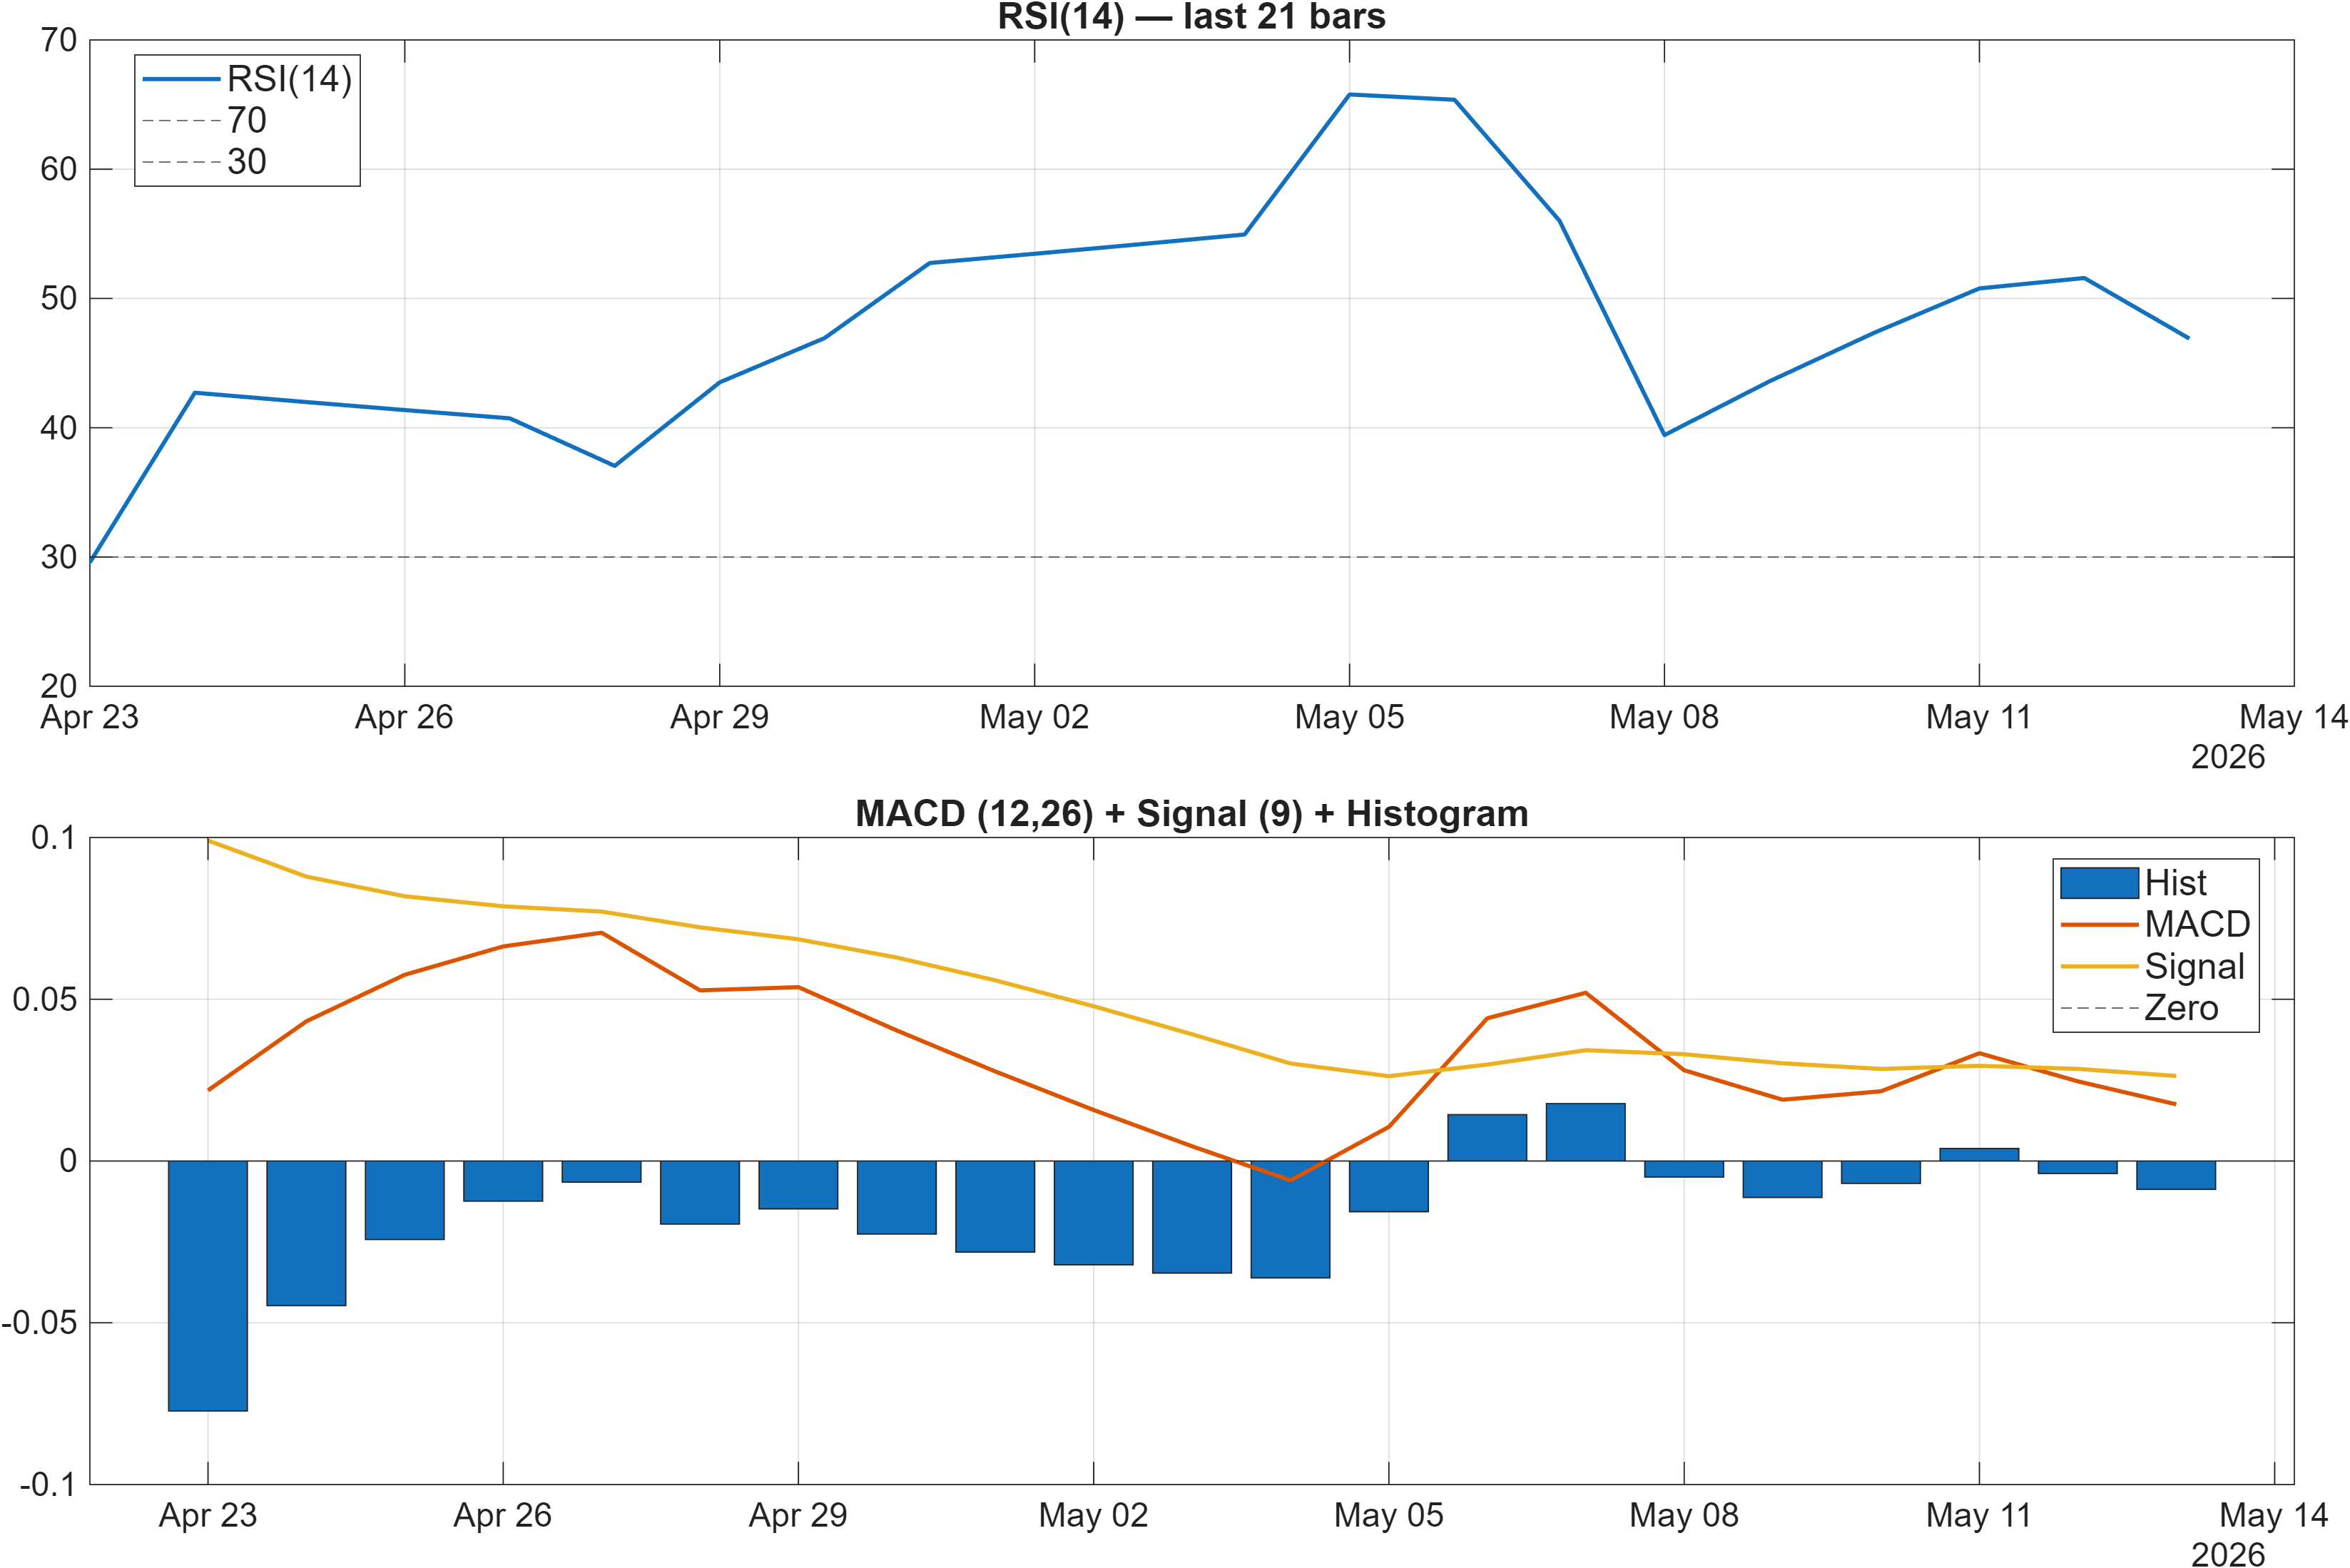
Interpretation: RSI bias = Neutral, MACD hist = -0.0088.
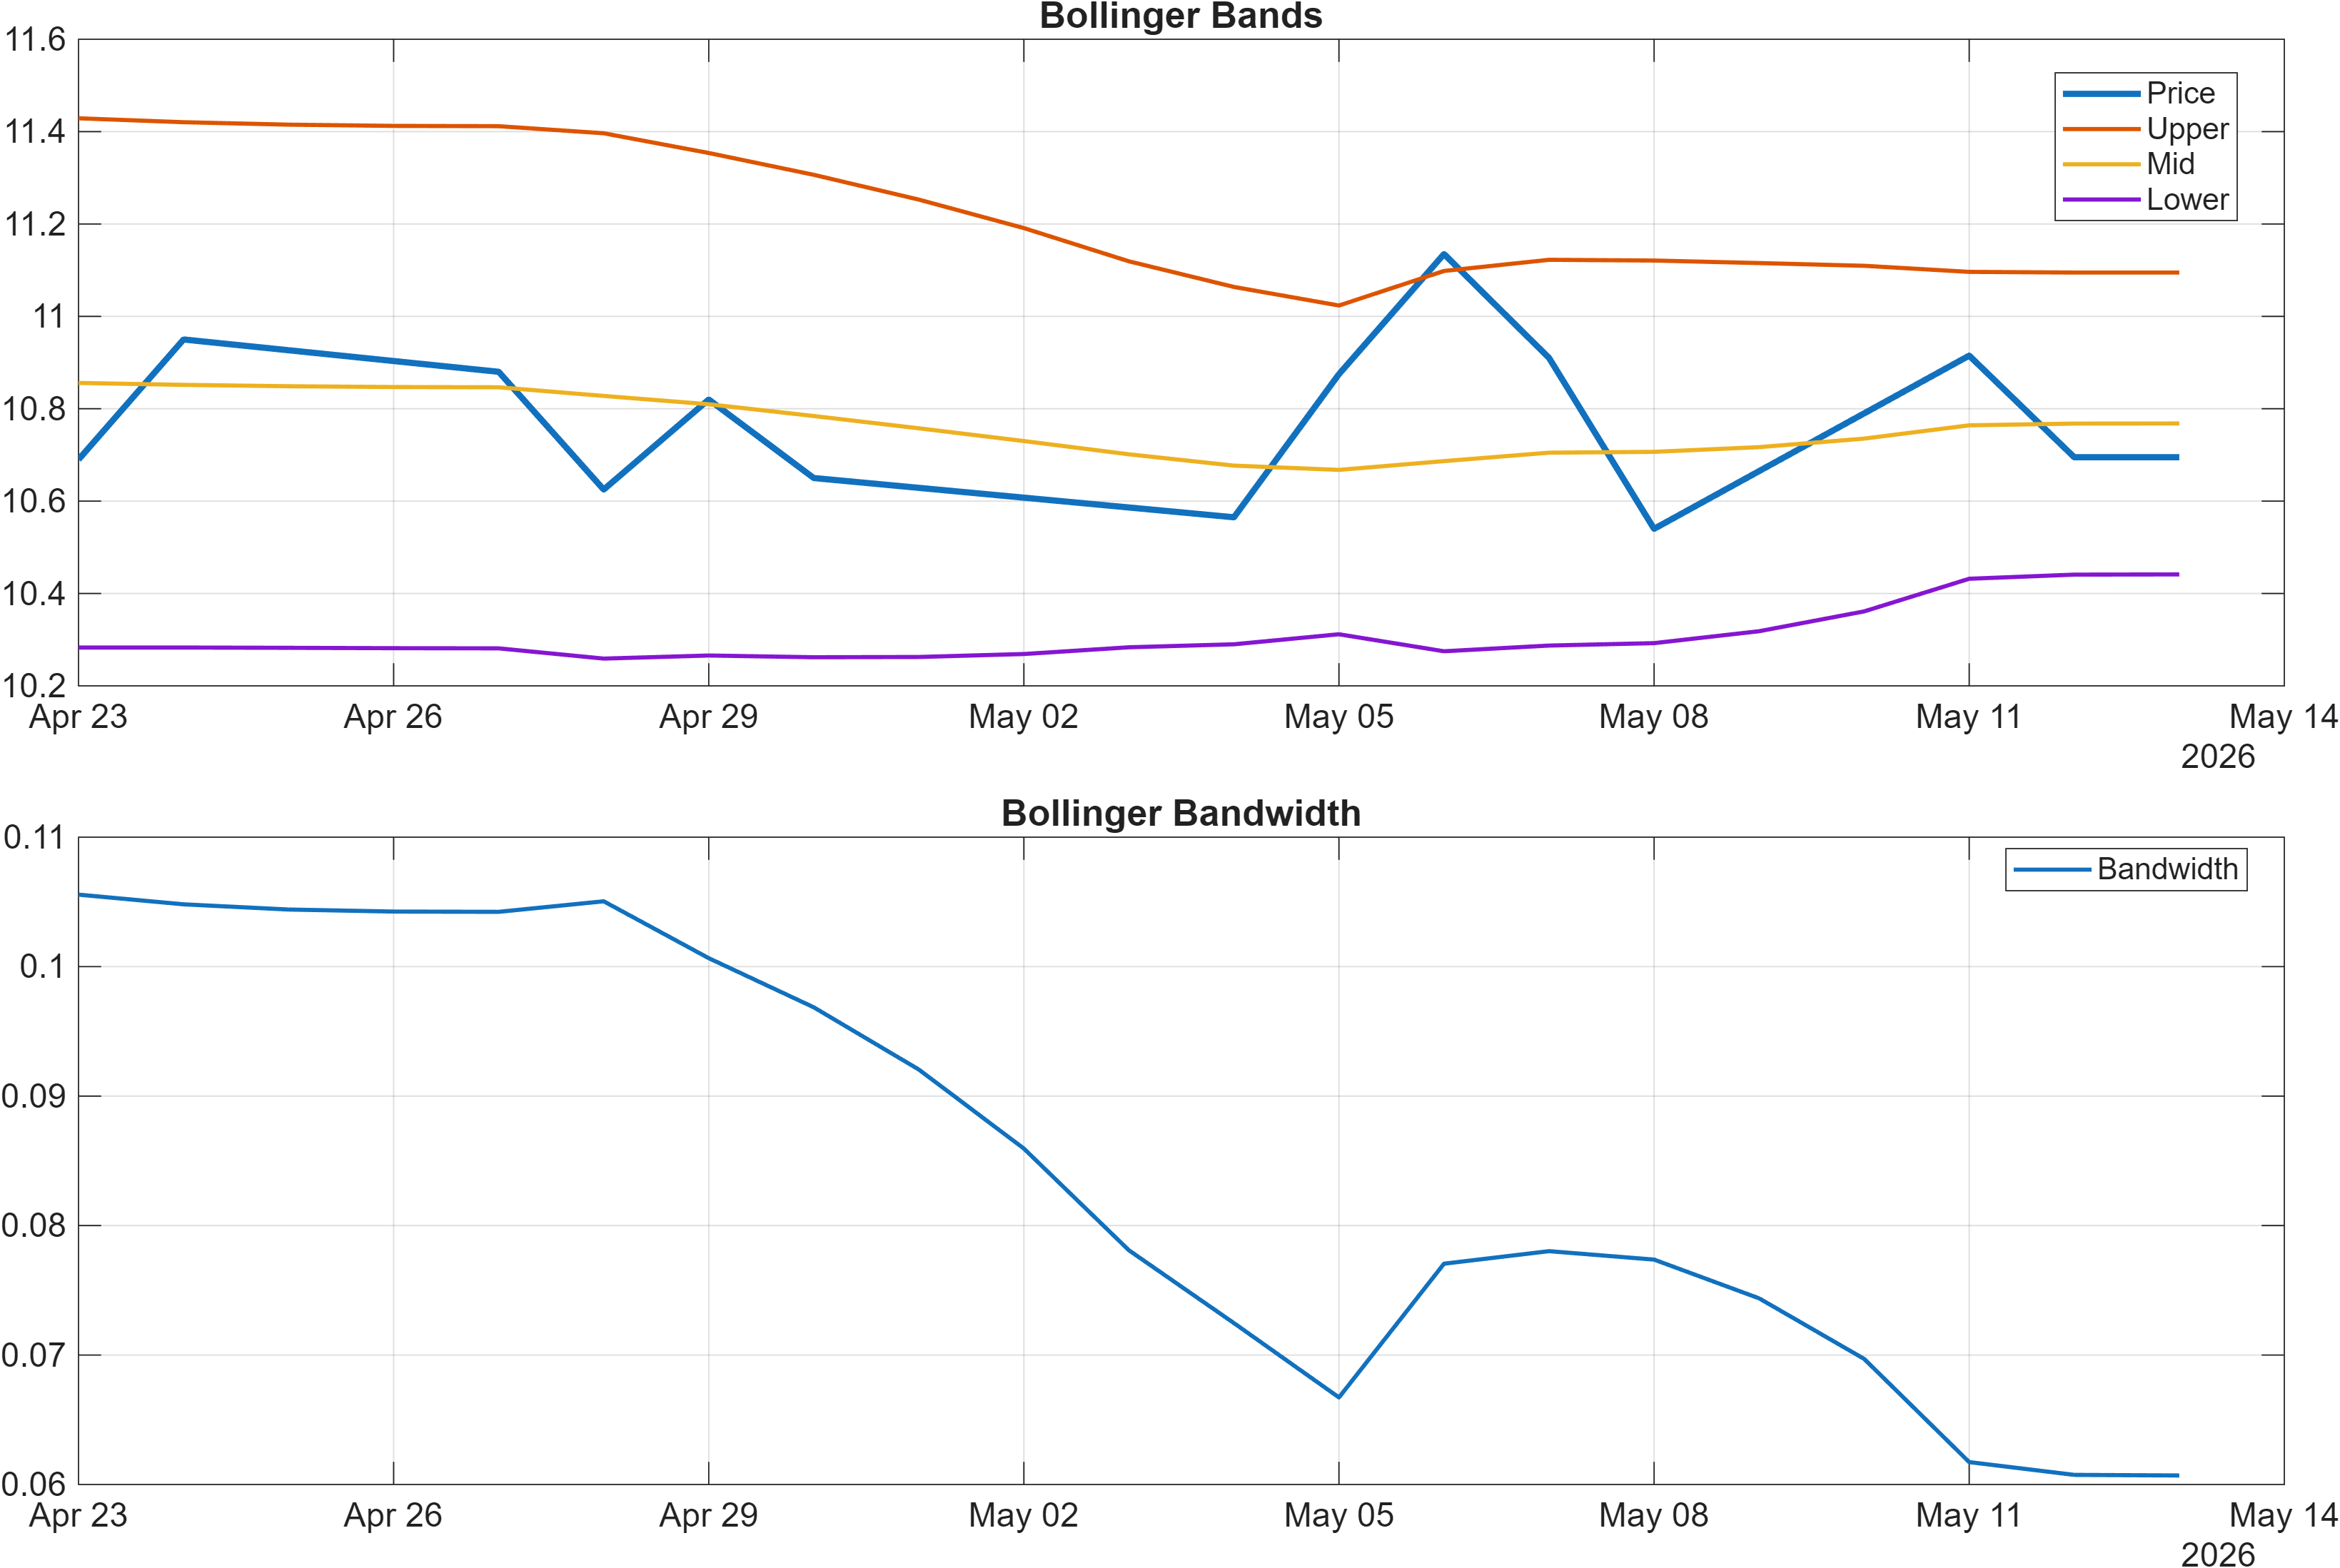
Interpretation: Bandwidth (volatility regime) latest = 0.0607.
Momentum softness within a contained volatility regime
Momentum indicators are not signaling capitulation, but they do lean toward subdued follow-through. RSI bias is Neutral (RSI(14) is 46.9 in the signal table), consistent with a market that is neither stretched oversold nor demonstrating strong upside impulse. At the same time, MACD histogram at -0.0088 points to negative incremental momentum, which often aligns with price trading below the MA50 (as noted in the trend overview).
Volatility conditions appear controlled rather than expanding: Bollinger bandwidth is 0.0607. In many tape conditions, a relatively contained bandwidth can coincide with range formation or a pause within a down-move. The interpretive risk is that compression can resolve in either direction; the stronger read comes from how momentum behaves into key levels rather than from bandwidth alone.
The rank picture helps adjudicate that ambiguity. With daily rank #1253 and weekly rank #1351 both Bearish, the probability-weighted interpretation is that momentum weakness is more likely to persist unless the market can shift to positive impulse near resistance. Put differently, the dashboard suggests a market that may be quiet but not constructive—neutral RSI and compressed volatility are not sufficient to offset the negative MACD impulse and weak cross-sectional standing.
4) Support / Resistance zones
Support ~ 9.4060 | Resistance ~ 11.2700
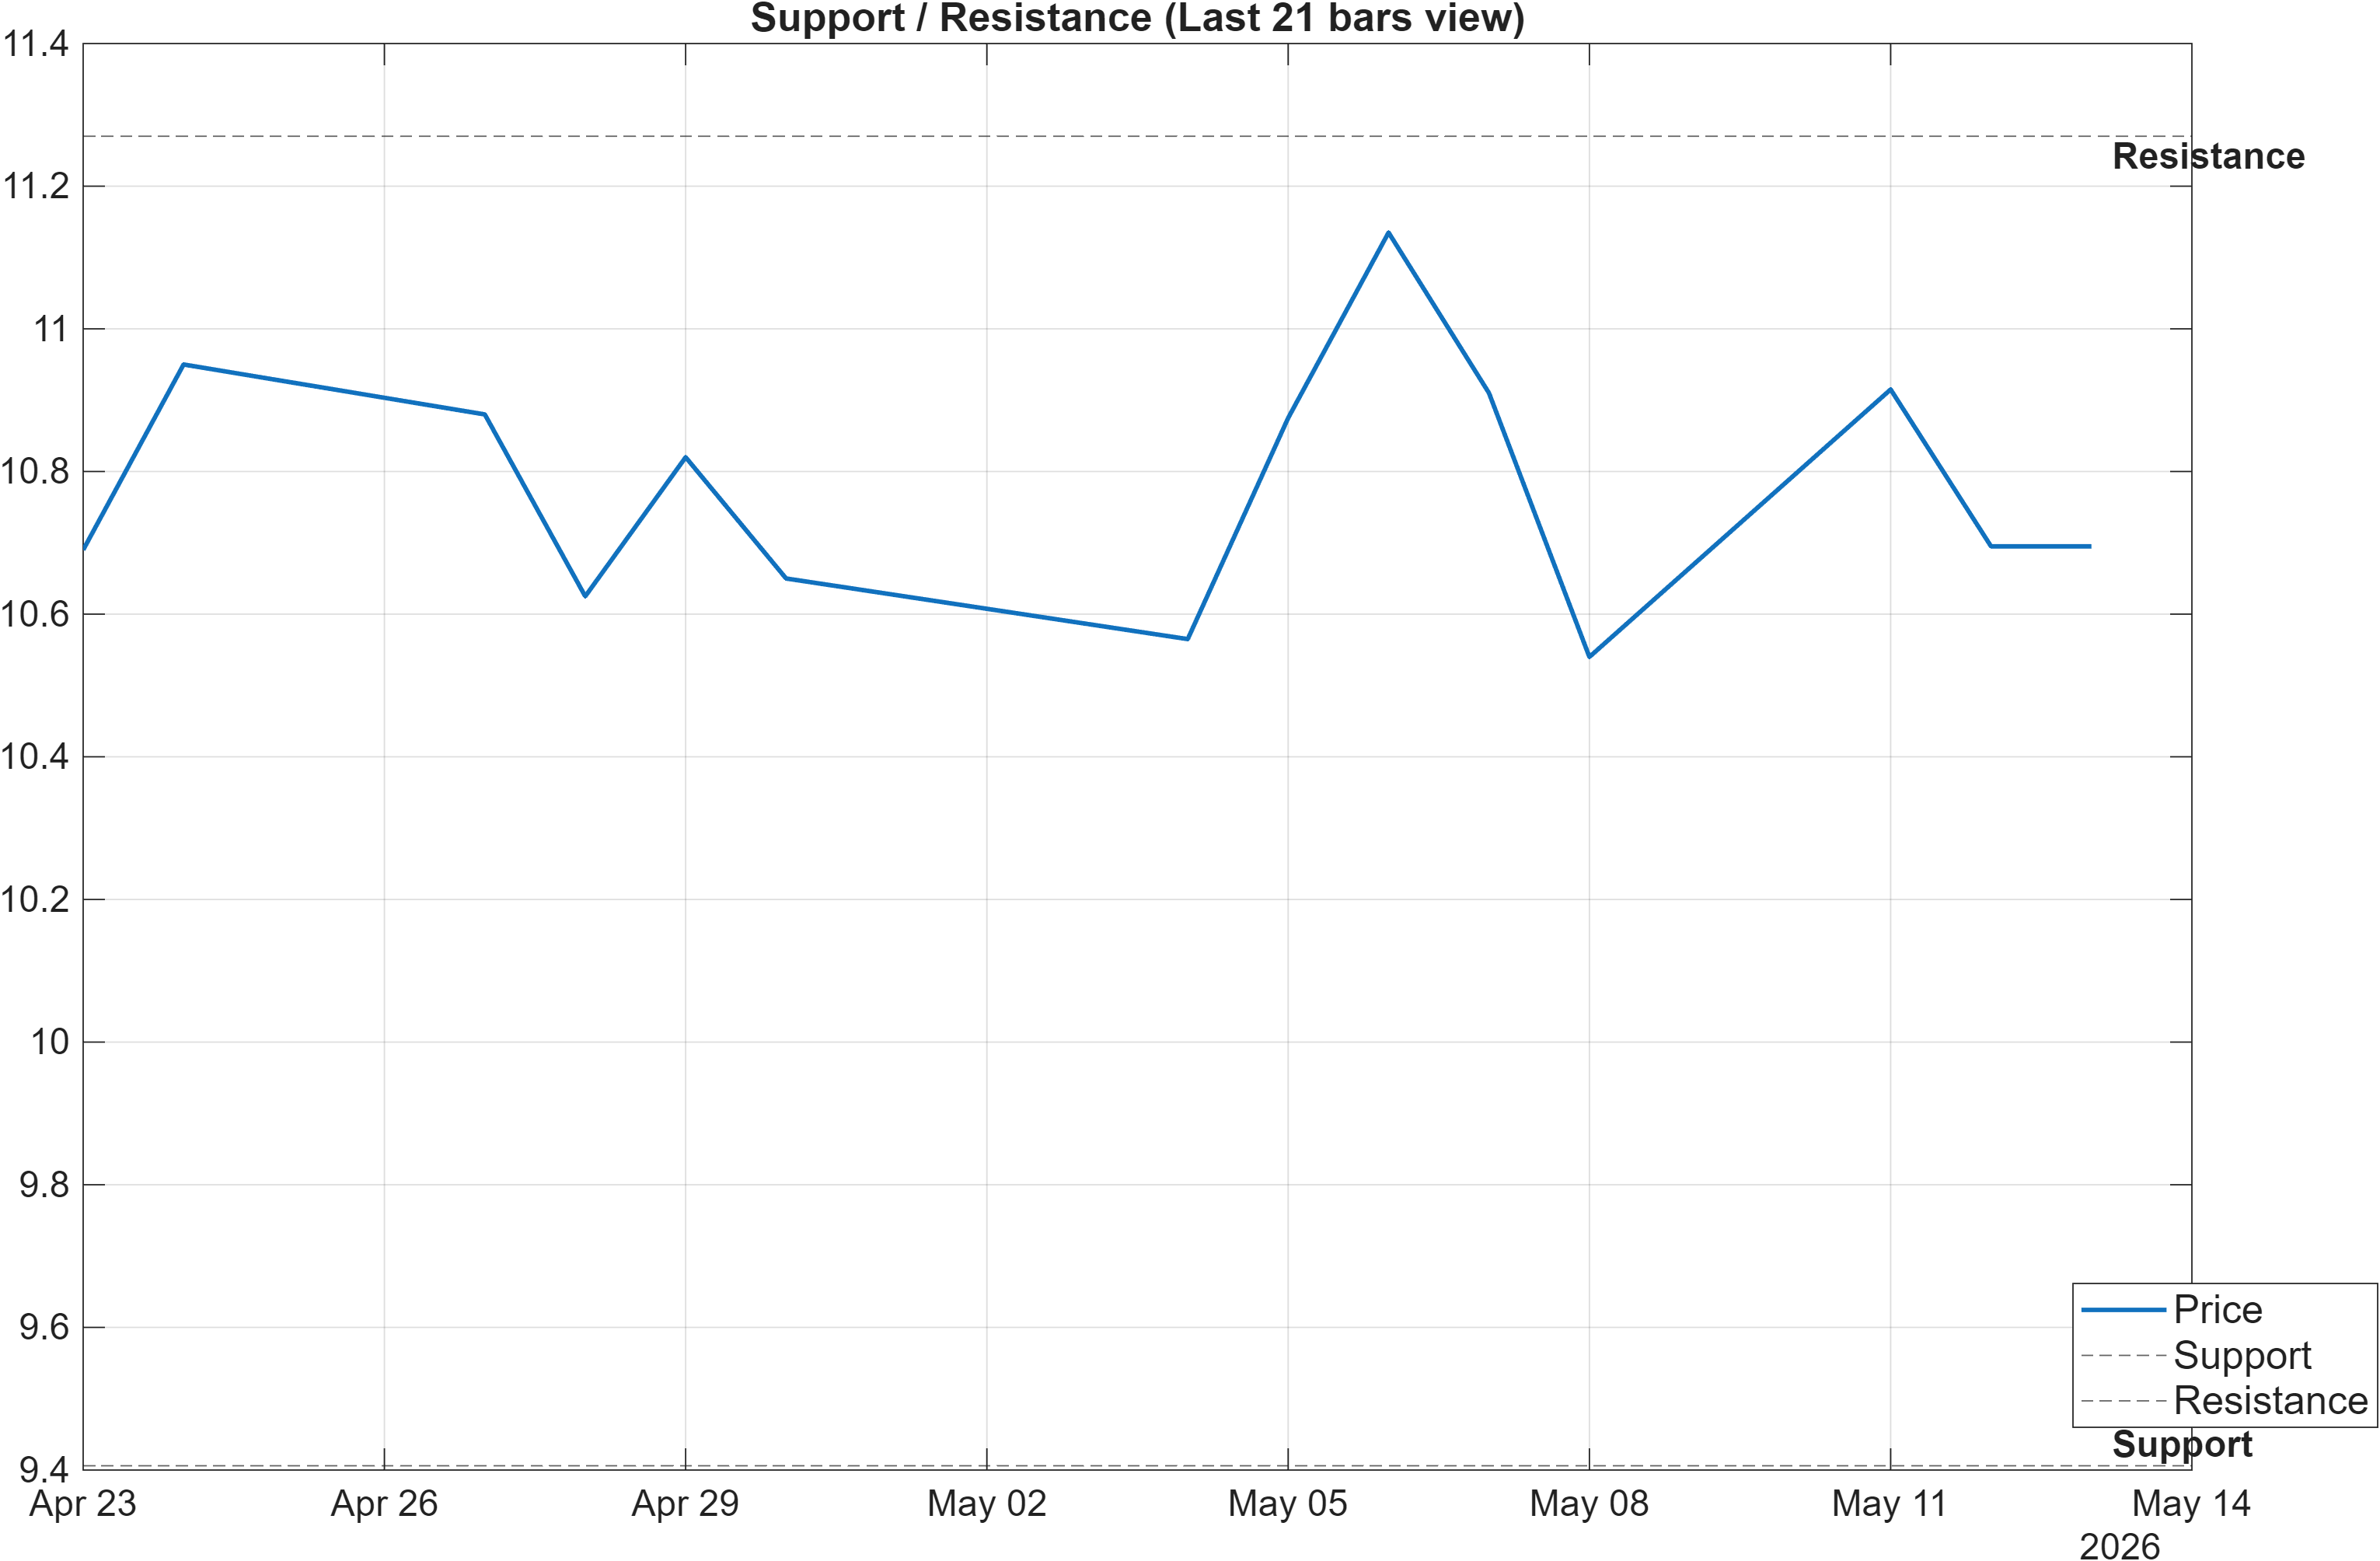
Scenario view: Break above resistance with volume → continuation. Close below support → signal deterioration risk.
Decision zones and state changes
The current map is clean: 9.4060 defines the nearby support zone and 11.2700 the primary resistance zone. Given the mixed regime—price below MA50 (Bearish) but MA50 above MA200 (Bullish)—these levels act less like “targets” and more like state boundaries that help separate a drifting pullback from a deeper breakdown.
The scenario framing is explicit about confirmation quality: a break above 11.2700 requires volume confirmation to qualify as continuation. That condition is particularly relevant when volatility is relatively contained (bandwidth 0.0607), because low-volatility advances can fail without broad participation. Conversely, the deterioration condition is simpler and more mechanical: a close below 9.4060 elevates downside risk, consistent with weak daily/weekly ranks (#1253 and #1351).
From a tactical perspective, the distance between these two zones also implies that range risk is meaningful: neutral RSI (46.9) and slightly negative MACD histogram (-0.0088) can coexist with oscillation until one boundary is resolved. In that environment, the more informative signal is often whether rebounds from support show improving internal confirmation (momentum turning, participation strengthening) rather than simply holding the level on low activity.
5) Quant Technical Dashboard (18 Signals)
KGNAI AI Technical Analysis Score (Deep Reinforcement Learning): Rank #247 out of 1418 (Rank 1 represents the strongest technical positioning and a higher probability of favorable price behavior. As ranks increase toward the maximum, the probability of favorable outcomes weakens and bearish positioning becomes more dominant.) | Label: Bullish | Score: 0.652
18-Signal Technical Confluence Score: 0.167 (Neutral)
Overall Technical Score (18-signal confluence + DRL rank blend): 0.312 (Bullish)
Note: The blended score reflects signal strength weighted against broader AI technical ranking, which may temporarily diverge.
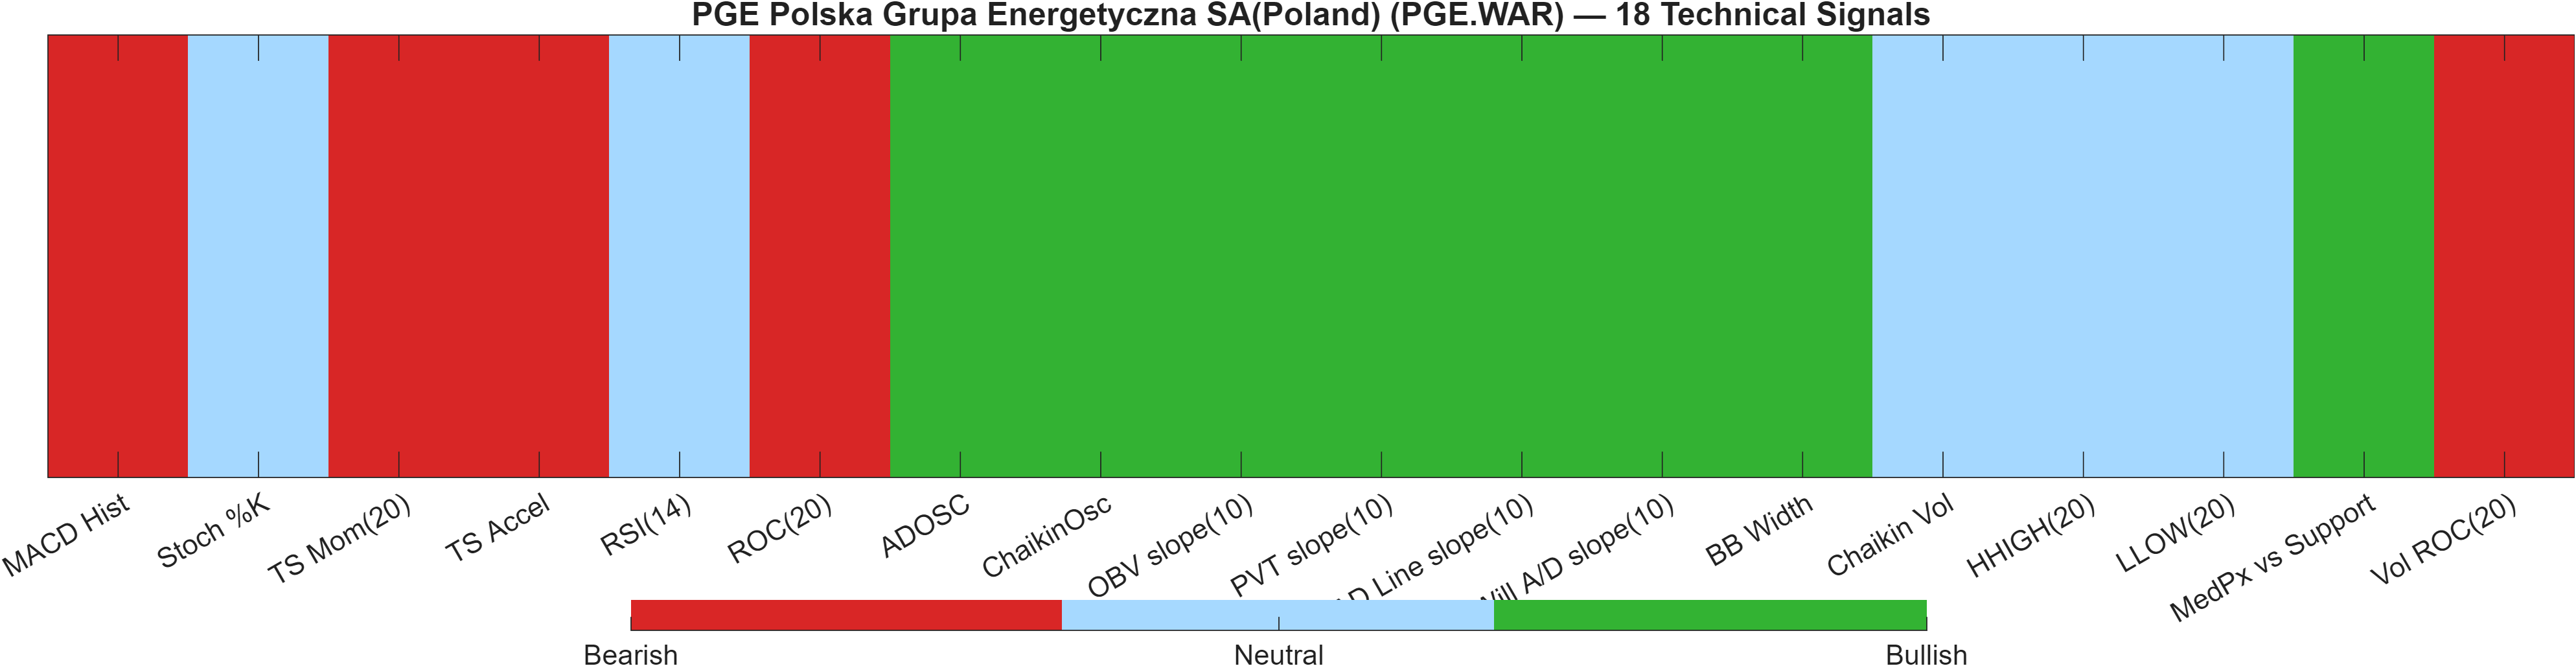
Blended technical score breakdown: 0.312 (Bullish | Bull 8 / Bear 5 / Neutral 5)
Confluence vs. model rank: a controlled divergence
The most notable feature in the dashboard is the divergence between the component set and the model blend. The 18-signal confluence score is 0.167 and labeled Neutral, yet the overall blended technical score is 0.312 with a Bullish label. This is reinforced by the DRL technical rank of #247 out of 1418, which sits in the stronger segment of the universe even as the multi-horizon KGNAI ranks remain Bearish.
Internally, the heatmap mix (Bull 8 / Bear 5 / Neutral 5) suggests selective strength rather than broad-based bullish alignment. The signal table supports this: multiple volume/flow measures print Bullish (e.g., ADOSC 13.56, OBV slope(10) 3.525e+06), while momentum measures remain soft (e.g., TS Mom(20) -0.255, ROC(20) -2.329, and MACD Hist -0.008762).
This configuration is often consistent with a market where participation metrics are improving ahead of price, but momentum has not yet turned convincingly. The practical implication is to treat bullish components as potential early stabilization evidence rather than as confirmation, especially while the key boundary conditions remain 11.2700 overhead and 9.4060 below.
Signal table (Bull/Bear/Neutral)
| Indicator | Value | Signal |
|---|---|---|
| MACD Hist | -0.008762 | Bearish |
| Stoch %K | 42.48 | Neutral |
| TS Mom(20) | -0.255 | Bearish |
| TS Accel | -0.219 | Bearish |
| RSI(14) | 46.9 | Neutral |
| ROC(20) | -2.329 | Bearish |
| ADOSC | 13.56 | Bullish |
| ChaikinOsc | 3.805e+05 | Bullish |
| OBV slope(10) | 3.525e+06 | Bullish |
| PVT slope(10) | 4.65e+04 | Bullish |
| AD Line slope(10) | 3.032e+06 | Bullish |
| Will A/D slope(10) | 0.565 | Bullish |
| BB Width | 0.0607 | Bullish |
| Chaikin Vol | -6.745 | Neutral |
| HHIGH(20) | 11.13 | Neutral |
| LLOW(20) | 10.37 | Neutral |
| MedPx vs Support | 1.391 | Bullish |
| Vol ROC(20) | -21.73 | Bearish |
Interpretation: Indicator-level signals form the base confluence, which is then adjusted using a separate AI-driven technical ranking model. The final technical score summarizes this combined view.
6) News sentiment + extractive gist
Note: Instrument-specific news matches were not found, so the digest includes broader market/sector headlines. Links are provided for verification.
Sentiment score (avg): 0.000 | Positive: 6% | Neutral: 88% | Negative: 6%
KGNAI AI News Sentiment Score (normalized -1 to +1): Not available (as of —) | Label: Not available | Overall news score: 0.00
Positive Developments
Recent coverage across major financial outlets reflects a generally steady information flow with limited instrument-specific catalysts, which is consistent with the neutral average sentiment (0.000) and the dominant 88% neutral classification. Within that set, the constructive tone is less about immediate upside drivers and more about context that can stabilize risk perception: periods where market narratives emphasize monitoring rather than shock events tend to coincide with contained volatility conditions, aligning with the technical view of compressed regimes (Bollinger bandwidth 0.0607). For PGE.WAR, that matters because the technical stack is currently mixed—momentum is soft (MACD histogram -0.0088) while some participation/flow signals are supportive—so a calmer headline environment can help the market “listen” to internal technicals rather than reacting to external jolts.
Neutral / Mixed Developments
The news digest is explicitly broader market/sector-oriented rather than company-specific, and the data reflects that: the sentiment split is tightly centered with 6% positive and 6% negative. In analytical terms, this is a low-conviction sentiment regime—useful for context, but unlikely to override technical levels. When sentiment is predominantly neutral, price tends to respond more directly to positioning and liquidity conditions, which places greater weight on the cross-sectional ranks (daily #1253, weekly #1351) and the nearby decision zones (9.4060 / 11.2700). For readers, the practical takeaway is that the informational backdrop does not currently provide a clear directional bias; it functions more as a volatility modifier than a catalyst.
Negative / Risk Signals
Even in a neutral aggregate mix, the presence of negative-risk framing in broad headlines can matter when an instrument is already weak on short horizons. With PGE.WAR positioned Bearishly in the daily and weekly ranks (#1253 and #1351), the market can become more sensitive to risk-off impulses, particularly if momentum remains negative (MACD histogram -0.0088) and volume conditions deteriorate (Vol ROC(20) is -21.73 in the technical table). The key risk is not that sentiment is strongly negative—it is not—but that weakly positioned assets can underreact on good days and overreact on bad ones. That asymmetry places additional emphasis on how price behaves if it revisits 9.4060, where a close below support would align technical, rank, and risk sensitivity in the same direction.
- Whether sentiment remains predominantly neutral (88%) or shifts toward a more directional mix.
- Price behavior and participation around 11.2700 (break attempts “with volume”).
- Any downside acceleration signals if price closes below 9.4060.
Sources referenced: Reuters, Bloomberg, Yahoo Finance, MarketWatch, Investing.com
Snapshot: AI Rank (Short–Mid–Long): Bearish (Bearish–Bearish–Bearish) · Technical Confluence: Neutral · Key Levels: Support ~9.41 | Resistance ~11.27 · News Sentiment: Neutral
7) Sources
Not available in the provided data.
You may also like: How KGNAI AI ranks instruments across global markets
Disclaimer: KGNAI provides AI-generated analytics and educational market commentary only. This is not financial advice. Markets involve risk. Always do your own research.