
Novartis AG (Switzerland) (NOVN.SW) — 20-Feb-2026 Neutral Ranks with Mixed Technical Signals
Novartis AG (Switzerland) (NOVN.SW) screens as a broadly balanced setup in KGNAI’s cross-universe framework as of 20-Feb-2026. Comparative ranks sit in the neutral middle of the 1,426-instrument EUROPE universe (e.g., Daily #405, Weekly #876, Monthly #991), suggesting neither persistent leadership nor clear underperformance pressure across time horizons. Technically, trend cues lean constructive with Close vs MA50 bullish and MA50 vs MA200 bullish, while momentum readings show an elevated RSI(14) of 81.59 alongside a positive MACD histogram of 0.2421. Volatility appears contained with Bollinger Bandwidth 0.1263, which often makes price more sensitive to defined decision levels. Those levels are tightly framed by Support ~108.8833 and Resistance ~125.9400. News sentiment is mildly constructive on balance (normalized 0.30) but still best treated as context rather than a standalone signal.
- Rank stance: Short Neutral | Mid Neutral | Long Neutral
- Technical confluence: 18-signal score 0.611 Bullish, but blended overall score 0.153 Neutral
- Key levels: Support 108.8833 | Resistance 125.9400
- News sentiment bias: normalized 0.30 Bullish; distribution 33% positive, 67% neutral, 0% negative
- Confirmation / invalidation: a break above 125.9400 with volume supports continuation; a close below 108.8833 increases deterioration risk
KGNAI ranks instruments relative to large peer universes using multiple AI tests and statistical models, focusing on how signals behave across regimes rather than isolated indicator extremes. The objective is to assess signal alignment, identify decision zones, and reduce interpretation bias through consistent, repeatable scoring.
- Ranks are comparative within the 1,426-instrument universe, not absolute forecasts.
- Confluence reflects agreement across signals; divergence can matter as much as confirmation.
- Support/resistance levels are decision zones where risk often changes quickly.
- Sentiment provides contextual bias and can amplify or fade technical setups.
1) KGNAI AI Analysis
Region: EUROPE
Total universe size: 1426 ranked instruments
- Daily rank: #405 out of 1426 — Neutral
- Weekly rank: #876 out of 1426 — Neutral
- Monthly rank: #991 out of 1426 — Neutral
- 3-Monthly rank: #482 out of 1426 — Neutral
- 6-Monthly rank: #332 out of 1426 — Neutral
- Yearly rank: #537 out of 1426 — Neutral
The rank profile for NOVN.SW clusters in the middle of the distribution across horizons, with the Daily rank (#405) sitting stronger than the Weekly (#876) and Monthly (#991) readings. That configuration often appears when shorter-term price behavior improves while broader comparative strength remains uncommitted. The 6-Monthly rank (#332) is comparatively firmer than the Yearly (#537), implying the intermediate window has been more supportive than the full-year snapshot.
Importantly, the term view remains Neutral across Short-term, Mid-term, and Long-term, which reduces the likelihood that a single timeframe is dominating the narrative. In practice, neutral clustering tends to shift attention toward confirmation conditions: a move through the upper decision zone near 125.9400 with supportive participation, or a failure that re-anchors risk toward 108.8833.
KGNAI ranks each instrument across large universes using multiple proprietary AI tests and statistical models (millions of data points). Lower ranks generally indicate stronger probability of favorable performance behavior, while higher ranks indicate weaker probability and more bearish positioning.
Term view: Short-term: Neutral. Mid-term: Neutral. Long-term: Neutral.
Want the full universe and complete rank tables? Unlock full access on KGNAI: https://www.kgnai.com/pricing
2) Price & trend overview
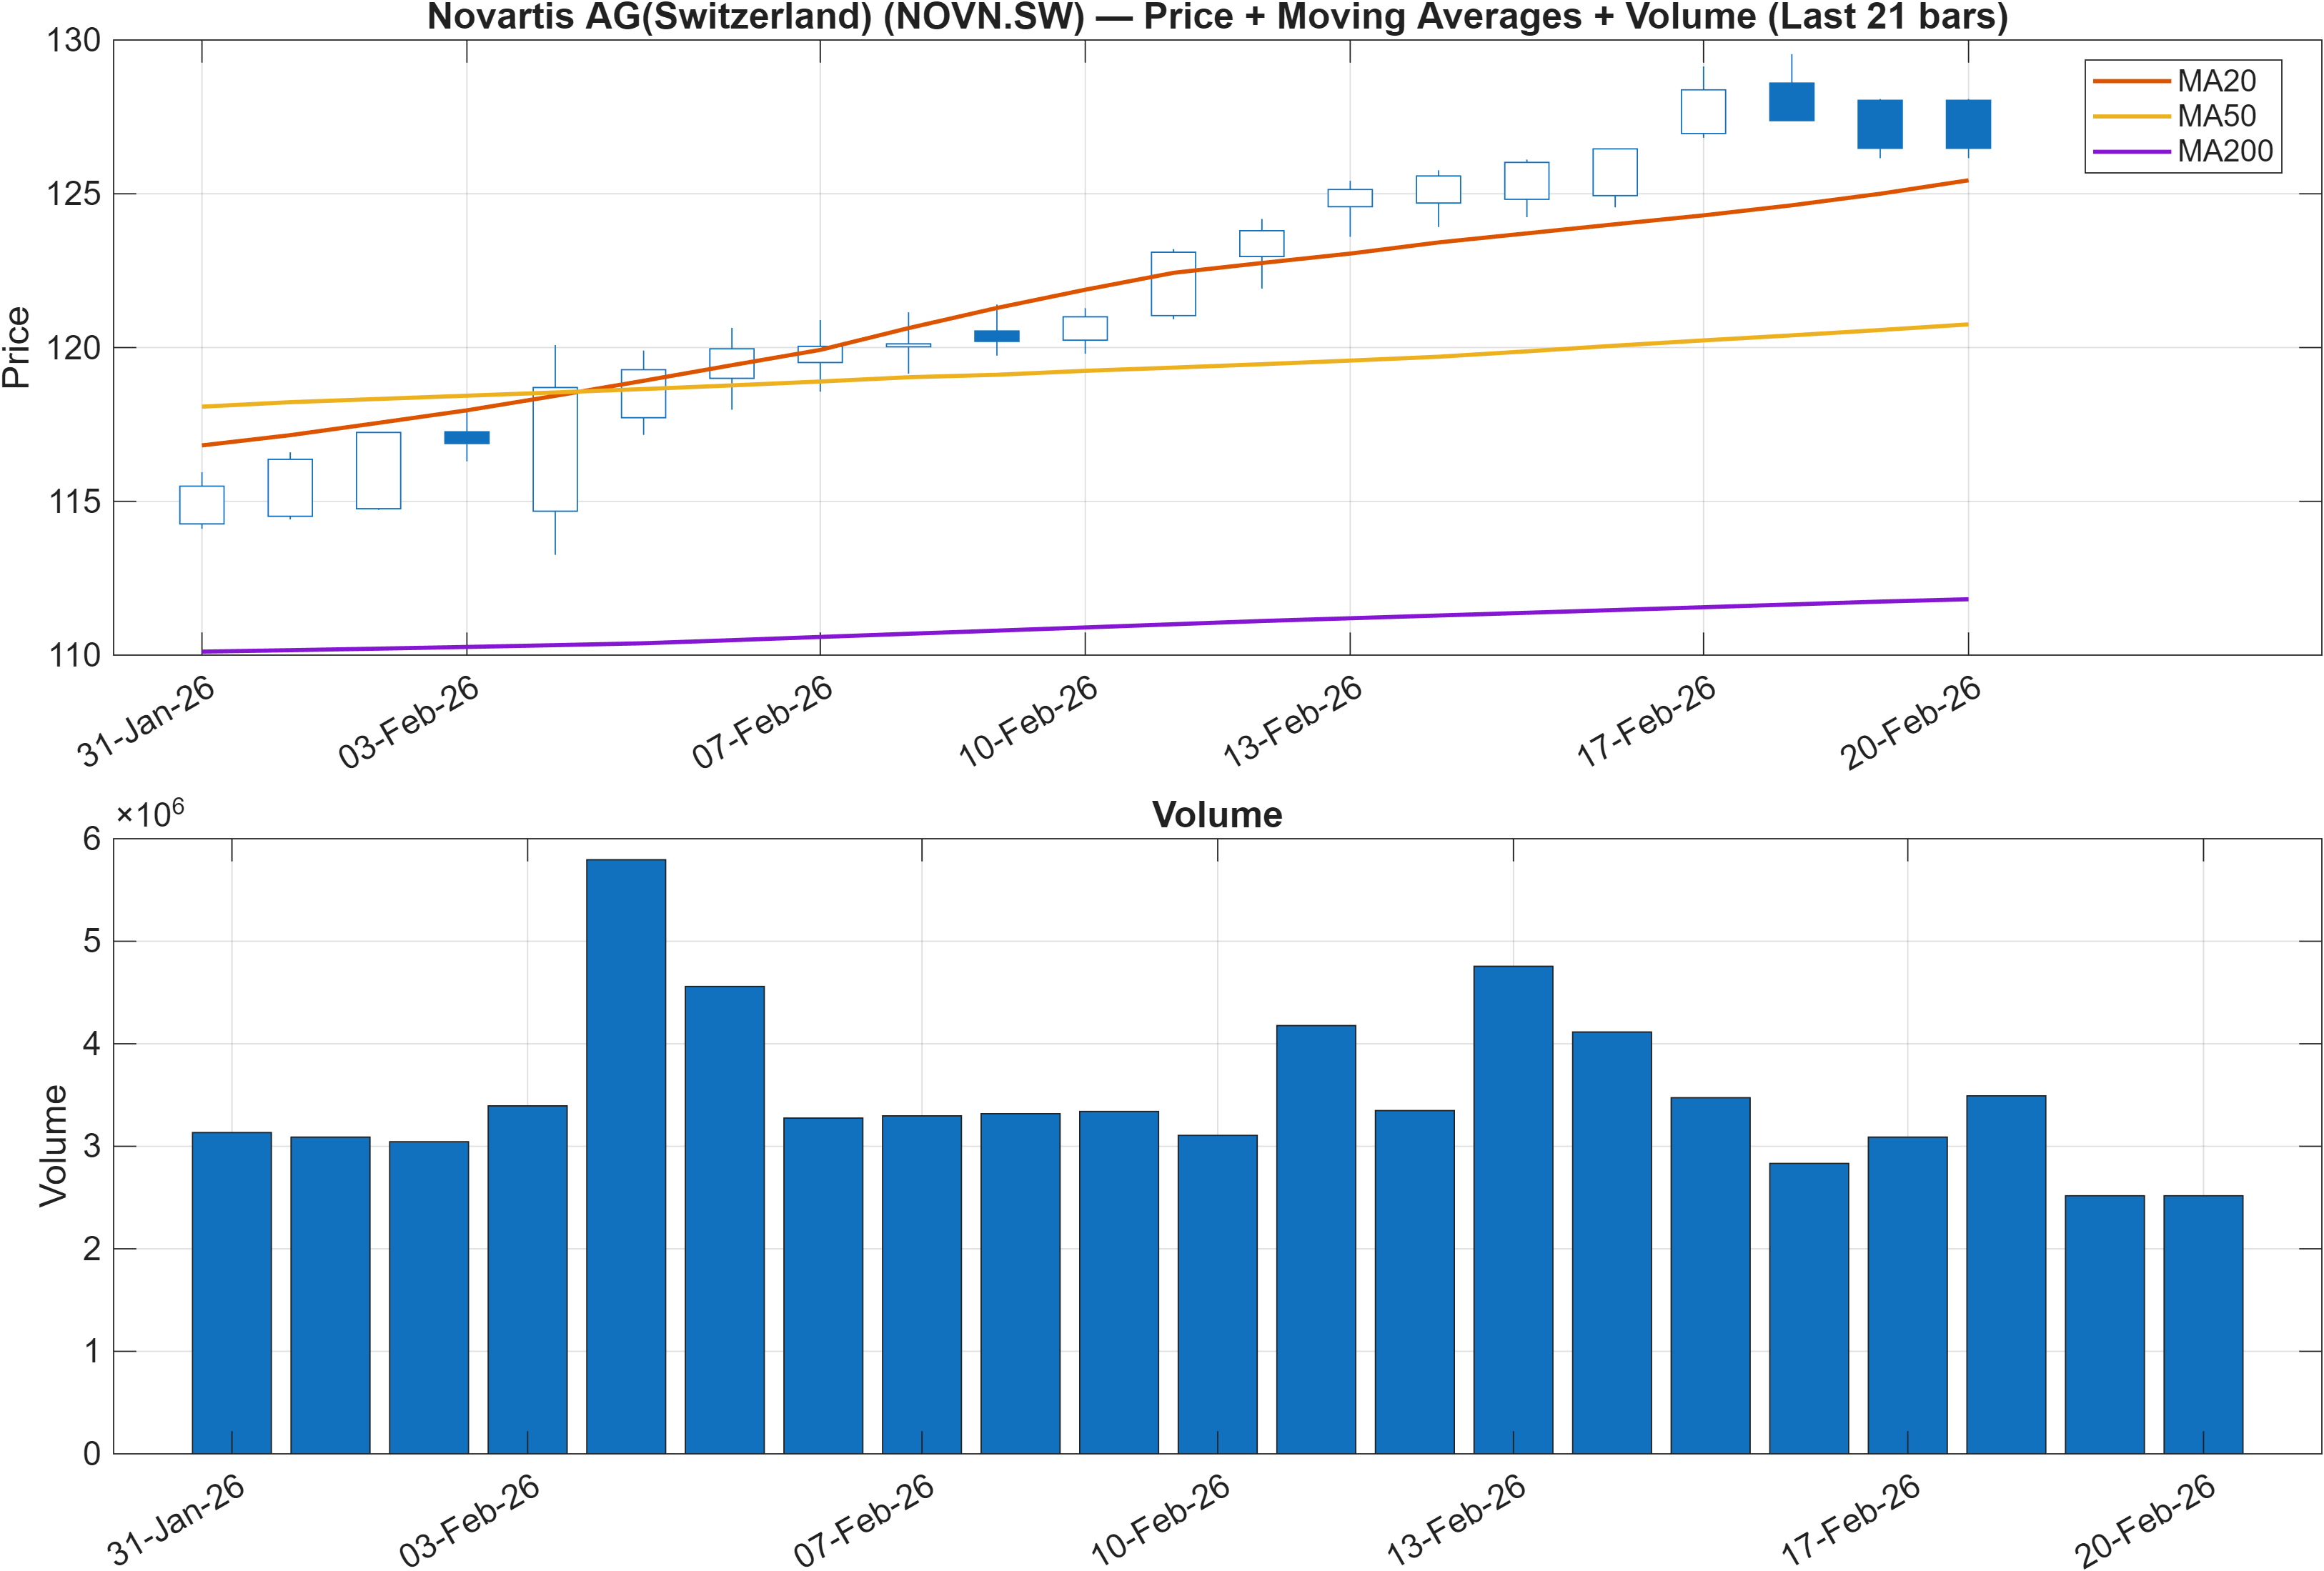
Interpretation: Close vs MA50 = Bullish, MA50 vs MA200 = Bullish.
The trend layer is constructive: price above the MA50 and MA50 above MA200 is a classical “trend-on” configuration, typically associated with smoother pullbacks when the structure holds. However, the broader KGNAI rank posture remains Neutral across horizons, which argues against over-weighting the moving-average view in isolation.
From a market-structure perspective, the defined upper boundary at 125.9400 sits close enough to matter as a “next liquidity test,” while 108.8833 functions as the more consequential downside pivot. When the trend is positive but the universe rank is neutral, the risk is less about trend direction and more about trend persistence: does strength remain supported by participation, or does it fade into range behavior?
The nearby volatility context supports that decision framing. With Bollinger Bandwidth at 0.1263, the tape is not displaying broad dispersion, so breaks can appear clean yet fail if volume and follow-through do not confirm. This aligns with the scenario logic around the level map: respect the trend bias, but require confirmation at resistance and disciplined risk management beneath support.
3) Momentum & volatility dashboard
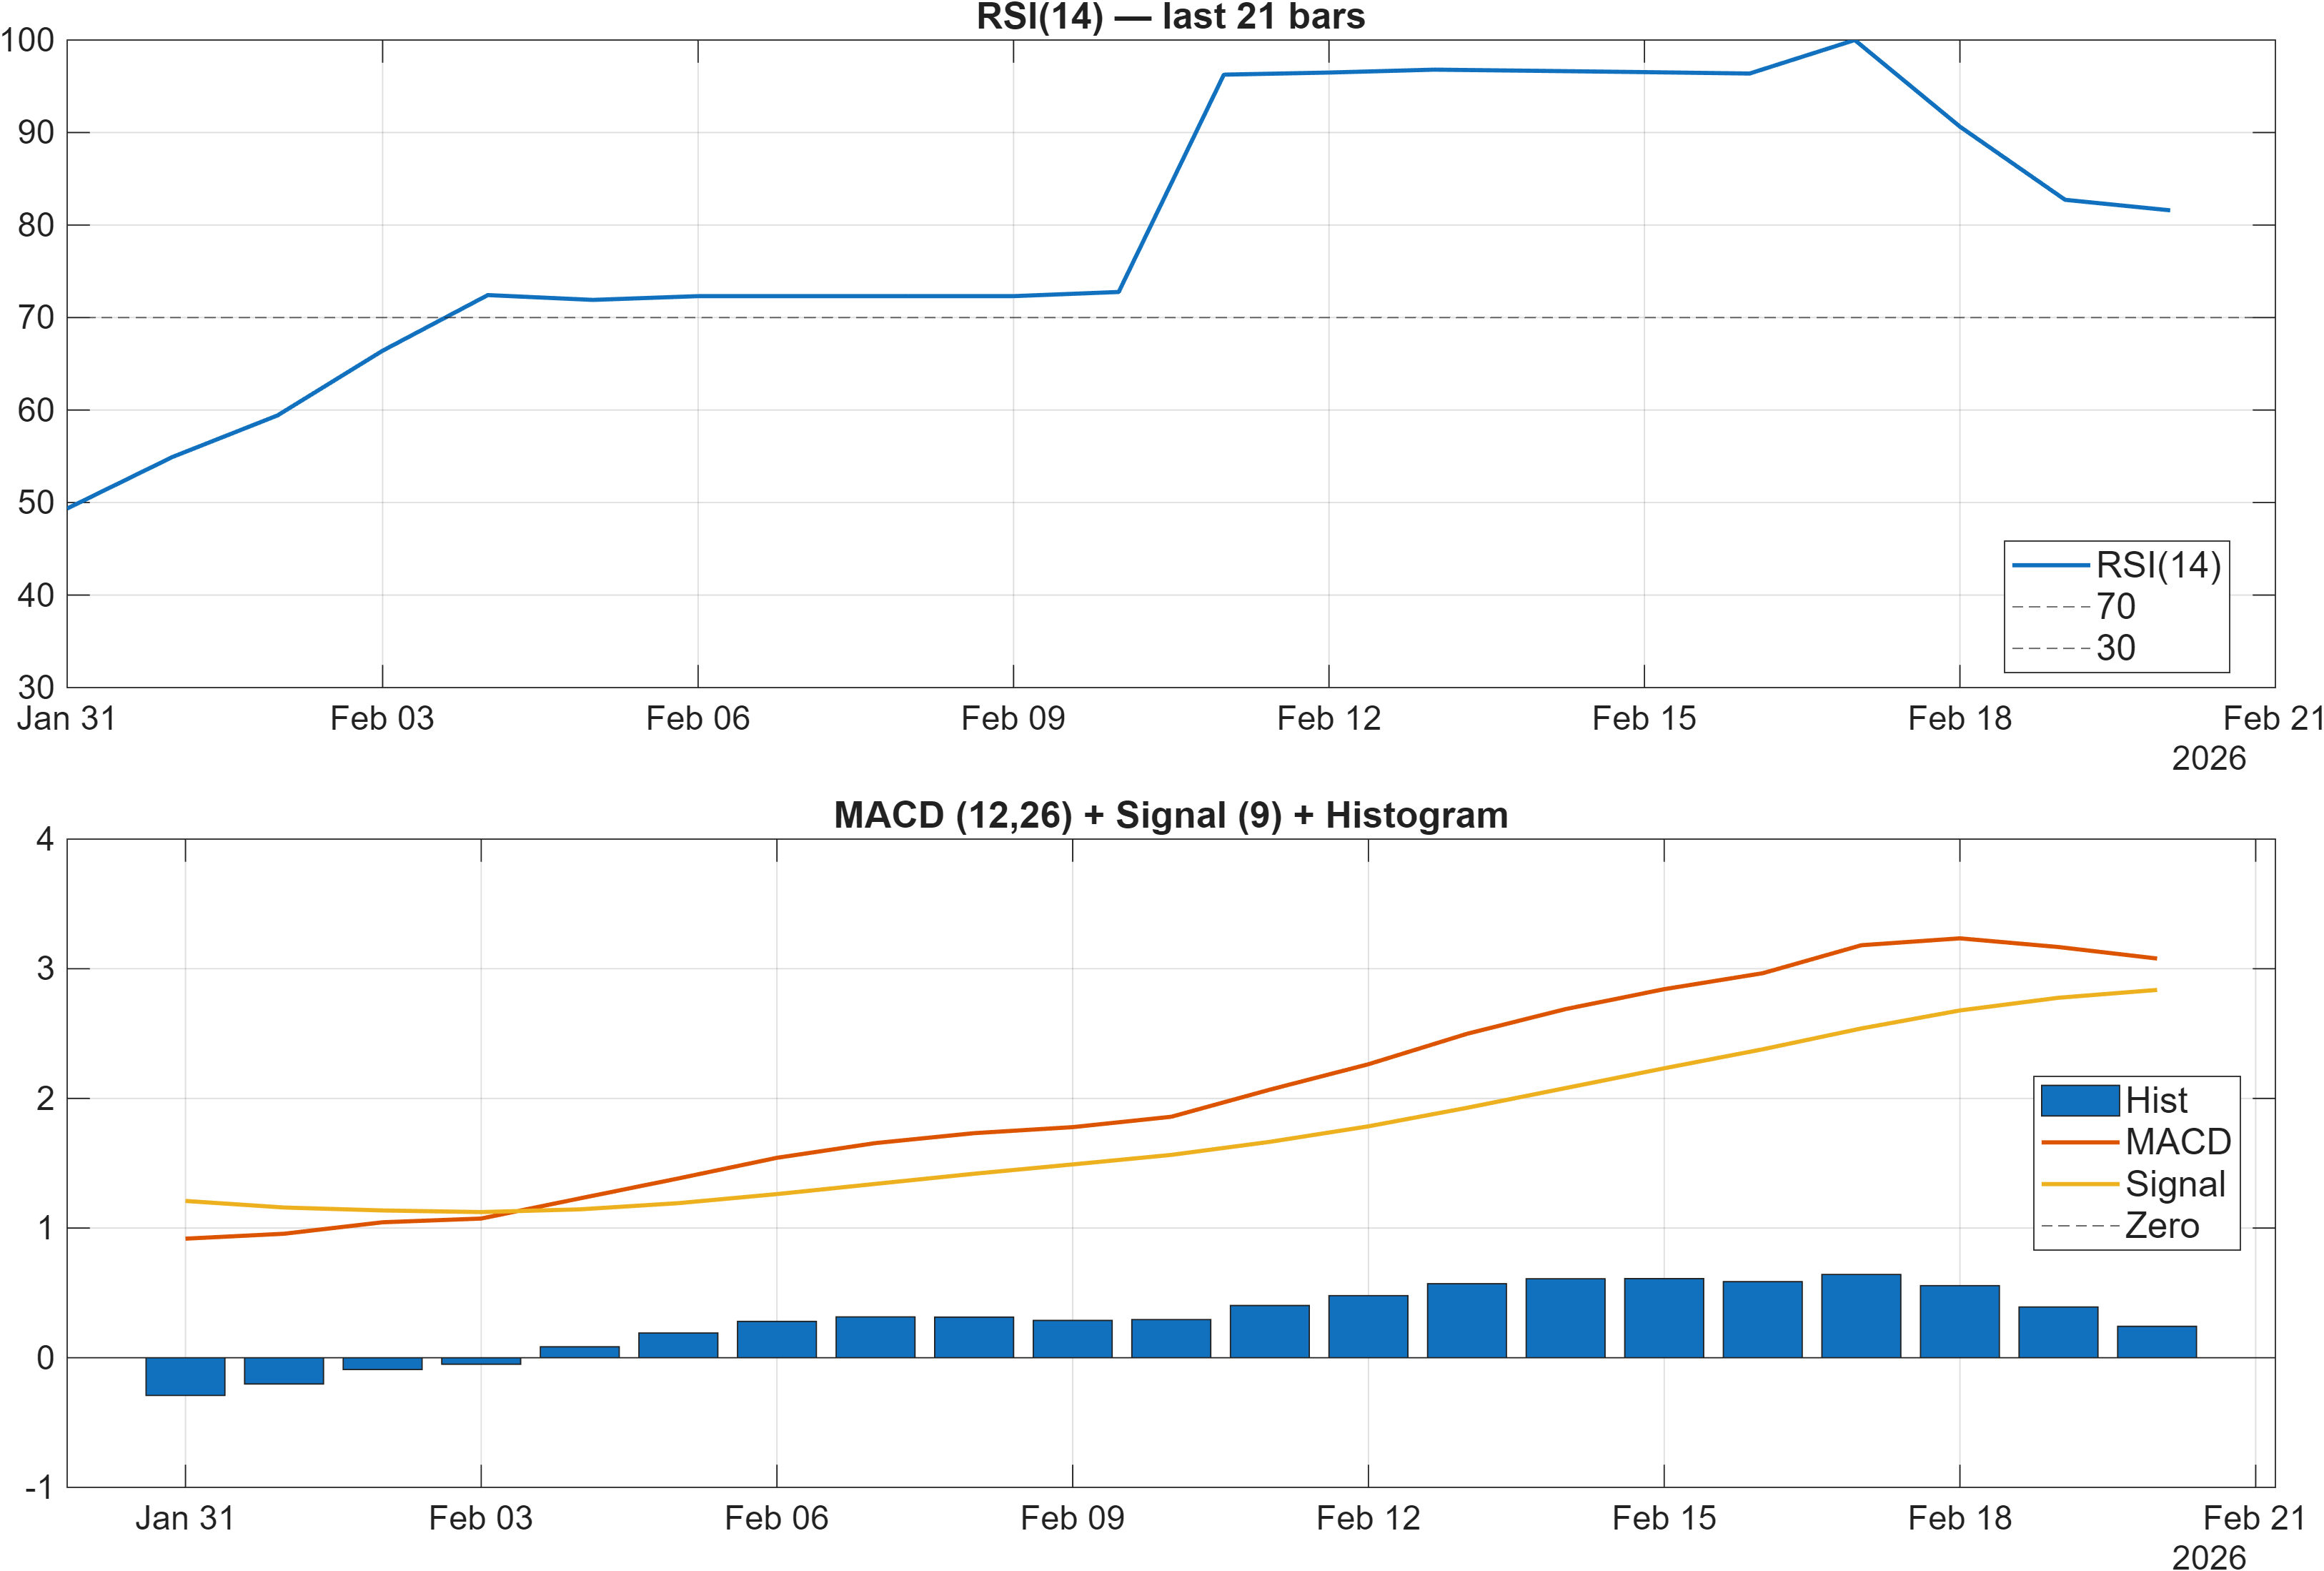
Interpretation: RSI bias = Bullish, MACD hist = 0.2421.
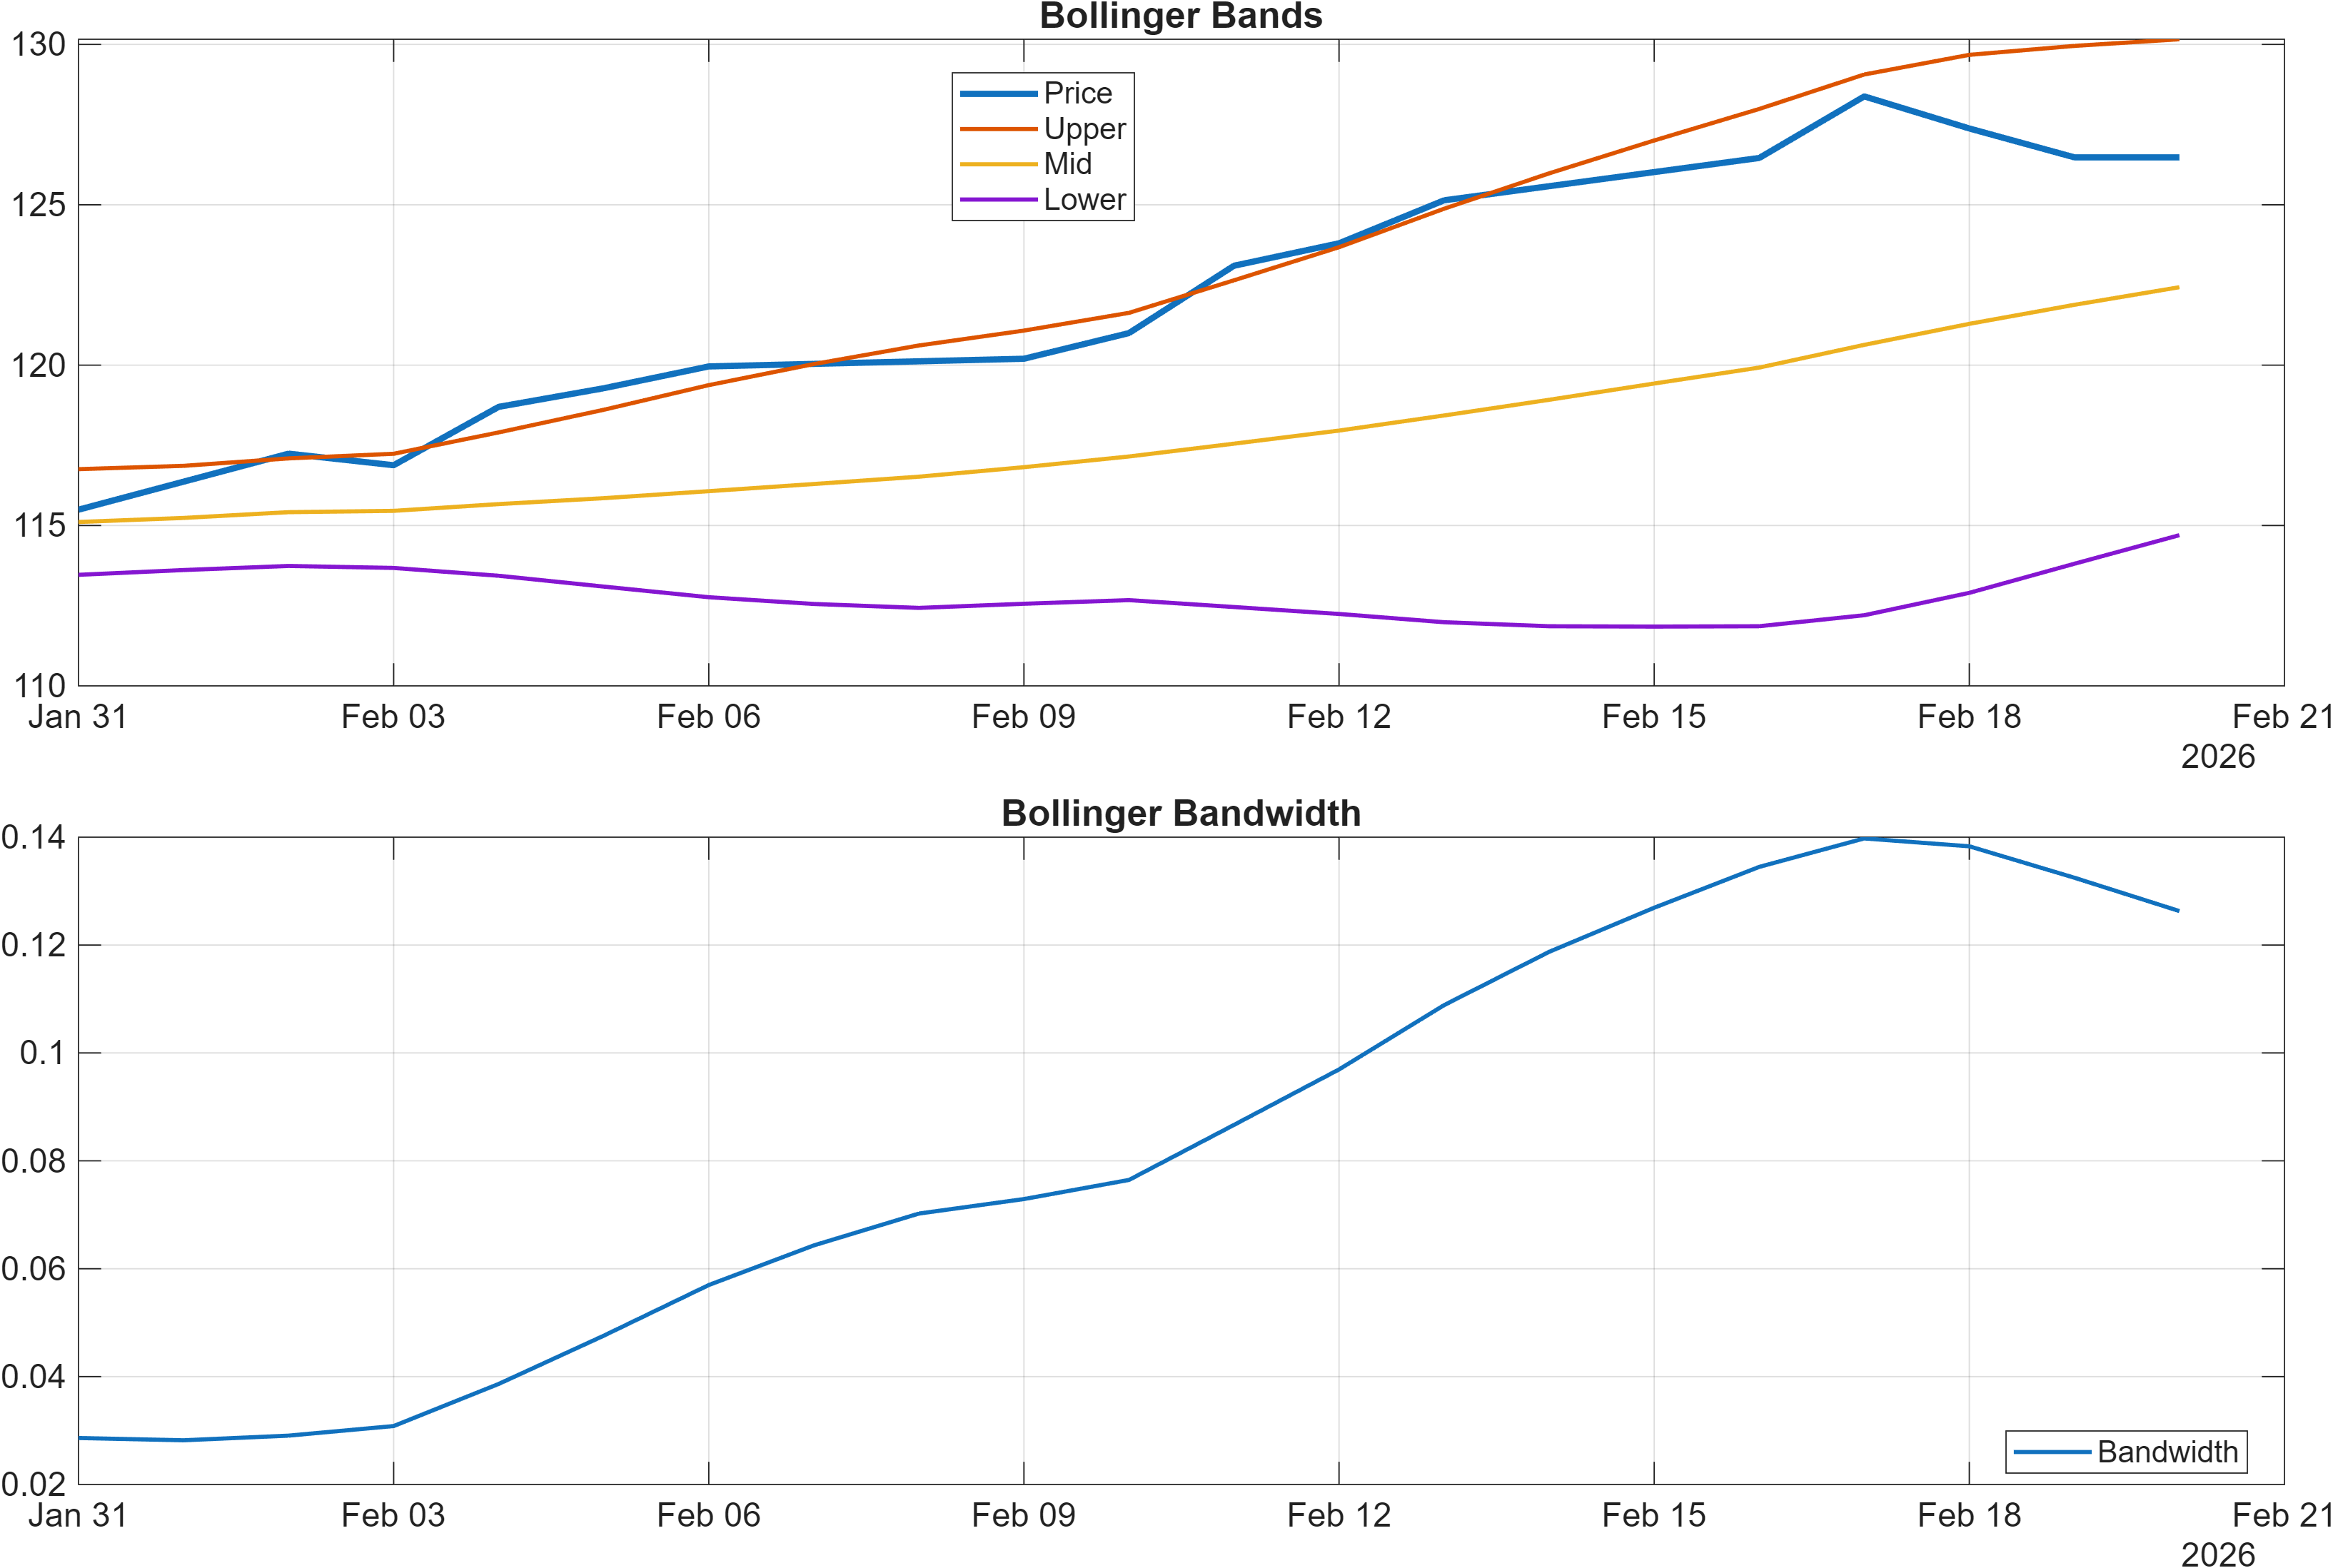
Interpretation: Bandwidth (volatility regime) latest = 0.1263.
Momentum signals are firm but unevenly informative at current levels. The MACD histogram at 0.2421 supports upside momentum persistence, while RSI(14) at 81.59 indicates a very strong oscillator reading. Elevated RSI can coexist with sustained uptrends; the analytical risk is that marginal upside becomes more dependent on fresh demand rather than mean reversion alone.
The volatility regime is relatively contained with BB Width 0.1263 (also flagged as Neutral in the signal table). In compressed conditions, price can travel further on smaller shocks, but the direction tends to be “decided” at well-advertised boundaries—particularly the 125.9400 resistance area. This increases the value of sequencing: first the break, then the confirmation.
The internal dashboard also shows a split between momentum and participation. Many flow/accumulation proxies are bullish in the 18-signal set, yet at least one volume-derived signal is explicitly bearish (Vol ROC(20) -18.5). That tension can matter: momentum can remain positive while volume change decelerates, a combination that sometimes precedes consolidation rather than immediate continuation.
4) Support / Resistance zones
Support ~ 108.8833 | Resistance ~ 125.9400
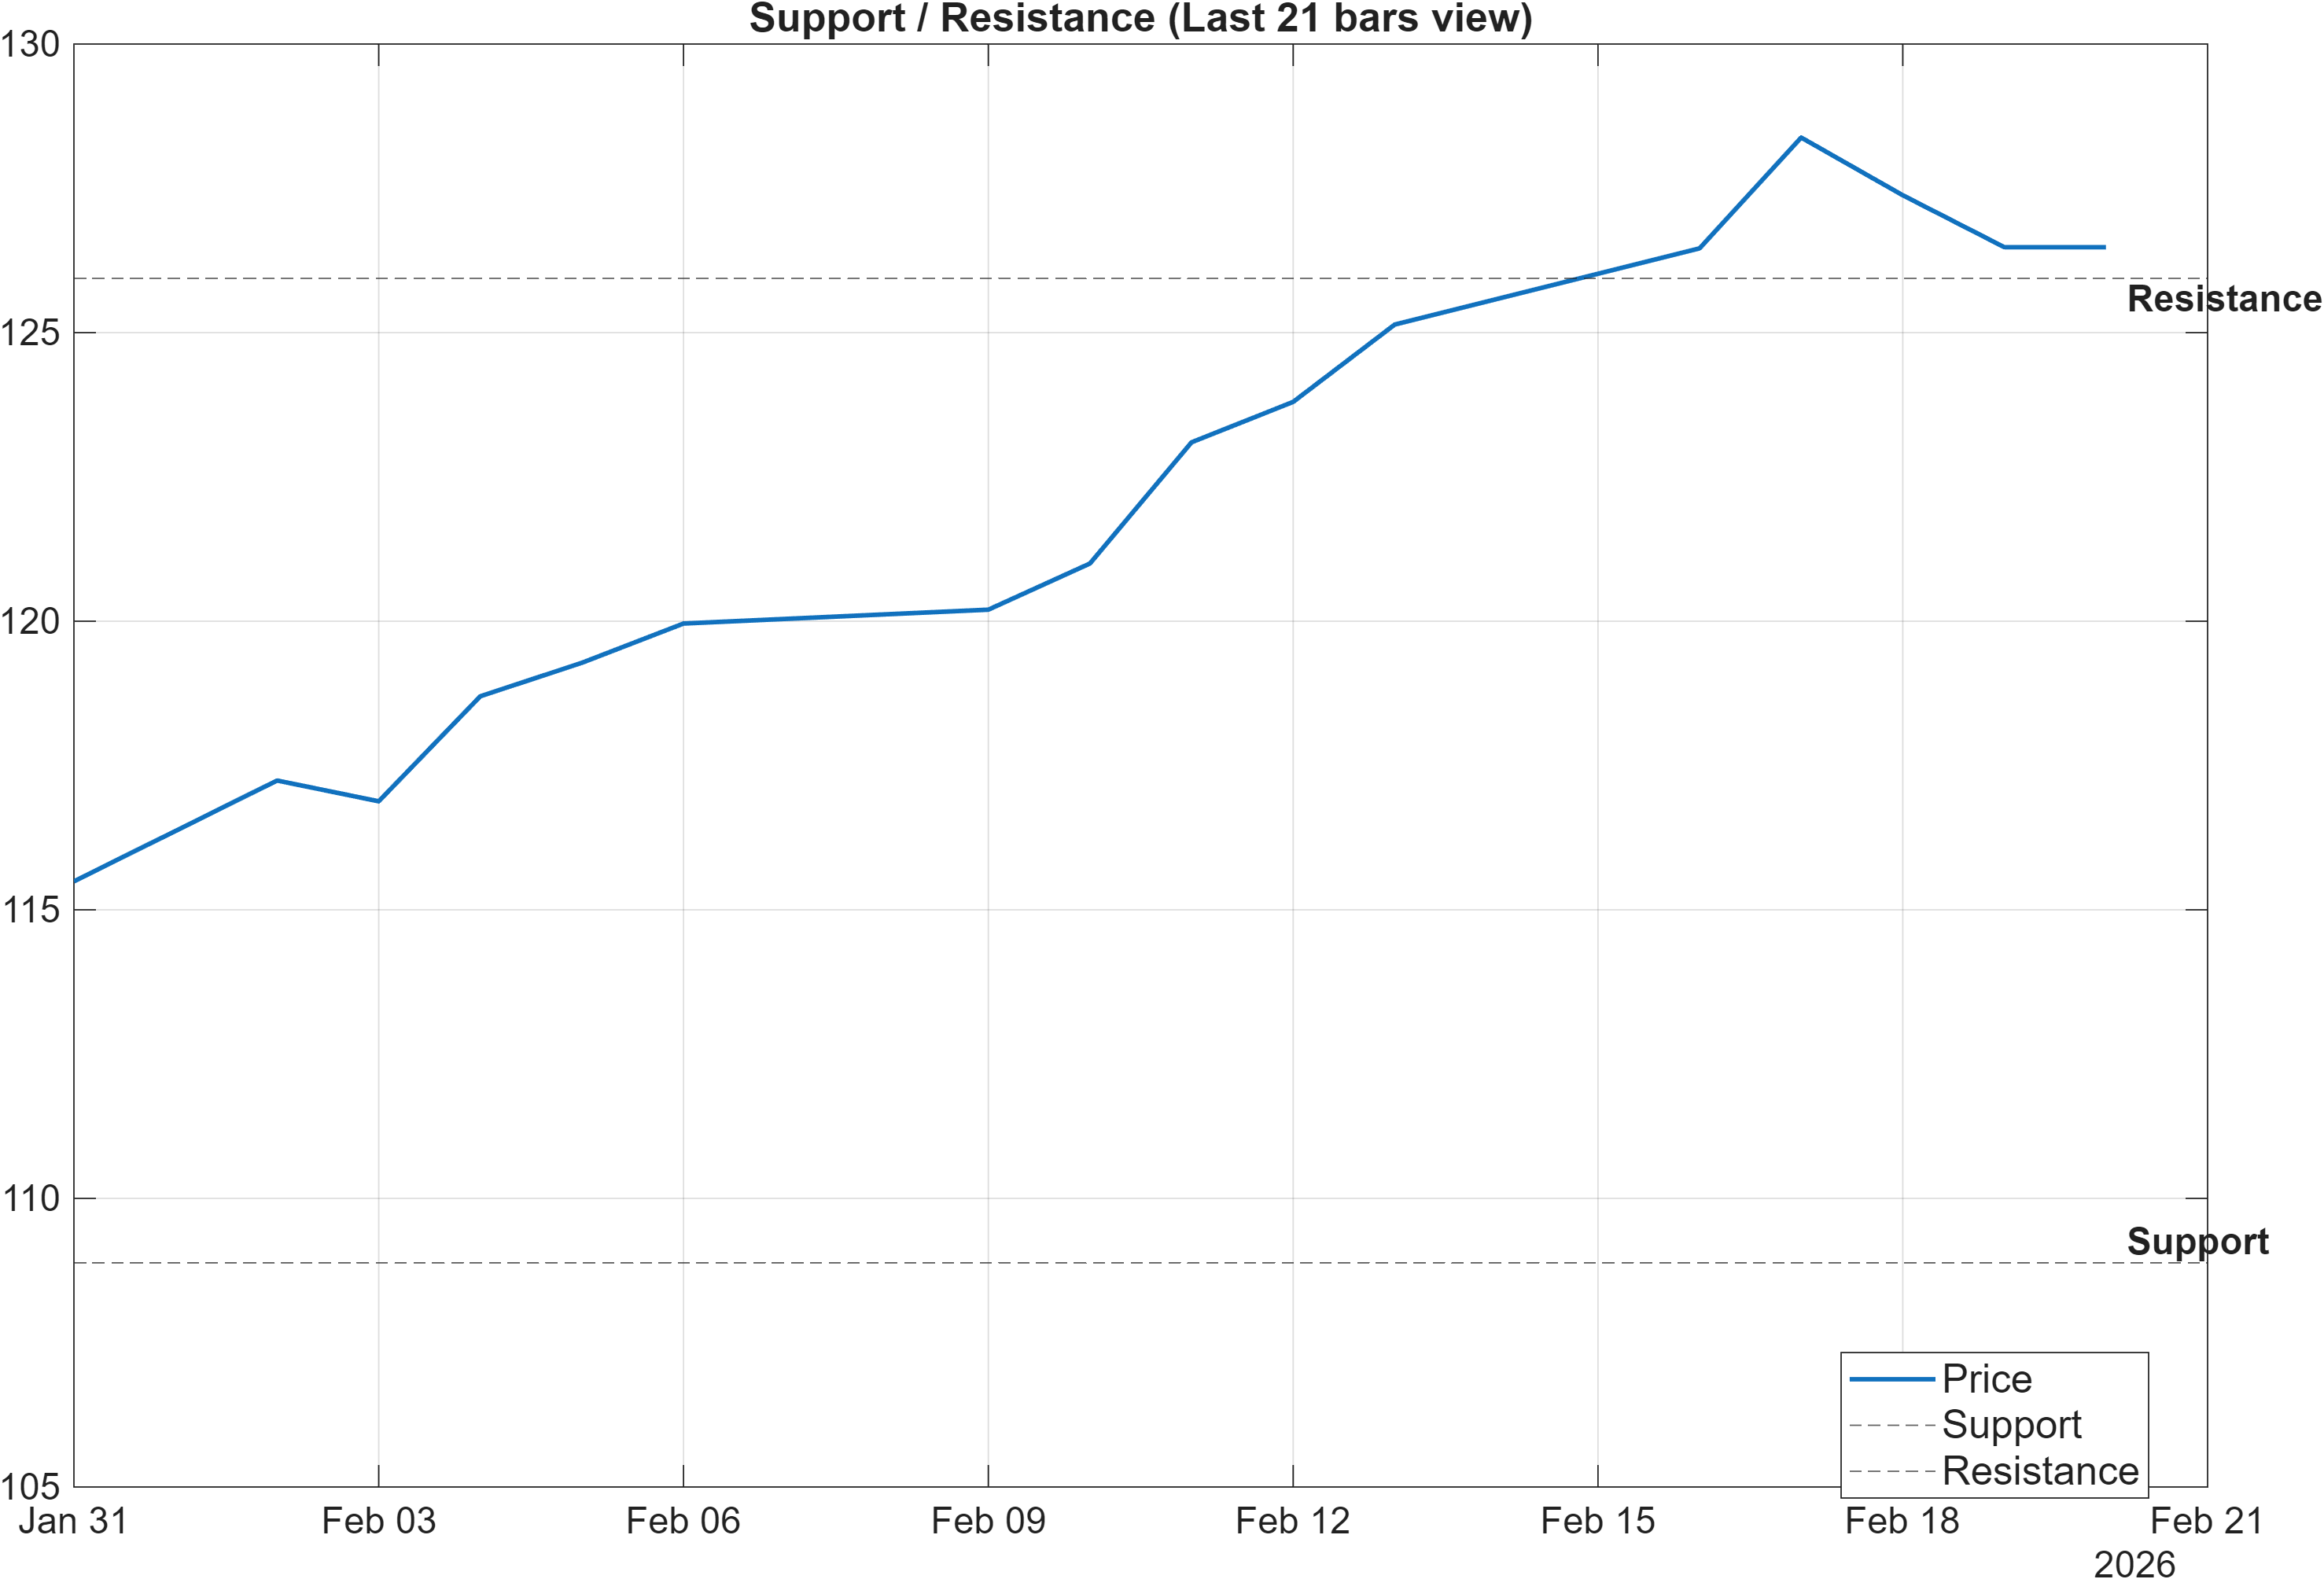
Scenario view: Break above resistance with volume → continuation. Close below support → signal deterioration risk.
The level structure is clean and interpretable: 108.8833 defines the primary downside decision zone, while 125.9400 marks the key upside gate. When a chart is simultaneously trend-positive (Close > MA50; MA50 > MA200) and volatility-contained (Bandwidth 0.1263), market participants often anchor positioning around these zones because they provide unambiguous triggers.
With RSI(14) at 81.59, resistance tests can become more binary: either the market absorbs supply and confirms, or it rejects and compresses. A successful move through 125.9400 is explicitly conditioned on volume confirmation, which is particularly relevant given the bearish reading in Vol ROC(20) (-18.5). If the breakout occurs on muted participation, follow-through risk rises even if momentum readings (like MACD hist 0.2421) remain positive.
On the downside, the report’s own deterioration condition is straightforward: a close below 108.8833 shifts the balance from “trend continuation with neutral ranks” toward a more defensive interpretation. In that scenario, the neutral rank posture (e.g., Weekly #876, Monthly #991) can become a headwind, as the instrument would be losing technical structure without the support of strong cross-sectional leadership.
5) Quant Technical Dashboard (18 Signals)
KGNAI AI Technical Analysis Score (Deep Reinforcement Learning): Rank #1365 out of 1426 (Rank 1 represents the strongest technical positioning and a higher probability of favorable price behavior. As ranks increase toward the maximum, the probability of favorable outcomes weakens and bearish positioning becomes more dominant.) | Label: Bearish | Score: -0.914
18-Signal Technical Confluence Score: 0.611 (Bullish)
Overall Technical Score (18-signal confluence + DRL rank blend): 0.153 (Neutral)
Note: The blended score reflects signal strength weighted against broader AI technical ranking, which may temporarily diverge.
Blended technical score breakdown: 0.153 (Neutral | Bull 12 / Bear 1 / Neutral 5)
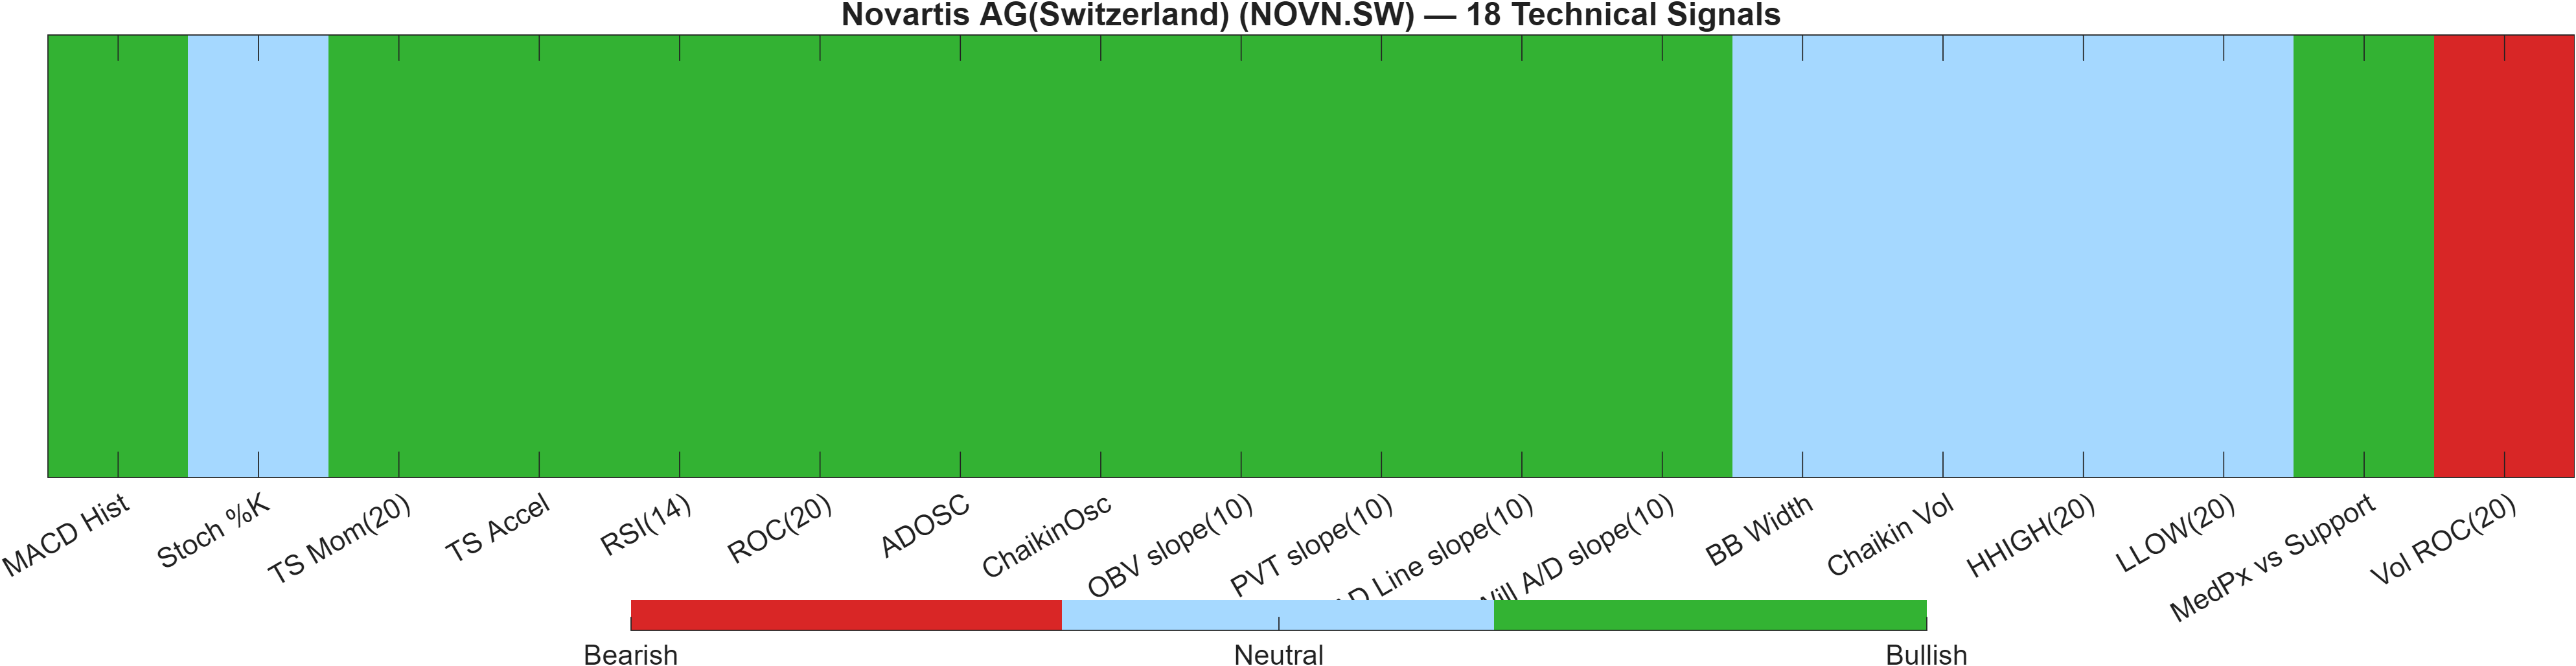
Signal table (Bull/Bear/Neutral)
| Indicator | Value | Signal |
|---|---|---|
| MACD Hist | 0.2421 | Bullish |
| Stoch %K | 64.5 | Neutral |
| TS Mom(20) | 10.11 | Bullish |
| TS Accel | 7.387 | Bullish |
| RSI(14) | 81.59 | Bullish |
| ROC(20) | 8.691 | Bullish |
| ADOSC | 9.375 | Bullish |
| ChaikinOsc | 2.411e+06 | Bullish |
| OBV slope(10) | 1.978e+07 | Bullish |
| PVT slope(10) | 1.815e+05 | Bullish |
| AD Line slope(10) | 1.279e+07 | Bullish |
| Will A/D slope(10) | 9.1 | Bullish |
| BB Width | 0.1263 | Neutral |
| Chaikin Vol | -8.236 | Neutral |
| HHIGH(20) | 129.5 | Neutral |
| LLOW(20) | 113.3 | Neutral |
| MedPx vs Support | 18.24 | Bullish |
| Vol ROC(20) | -18.5 | Bearish |
Interpretation: Indicator-level signals form the base confluence, which is then adjusted using a separate AI-driven technical ranking model. The final technical score summarizes this combined view.
NOVN.SW shows a notable model divergence that deserves explicit weighting. The 18-signal layer is Bullish with a confluence score of 0.611, supported by momentum/flow measures such as RSI(14) 81.59, ROC(20) 8.691, and a positive MACD histogram 0.2421. By count, the blend reports Bull 12 / Bear 1 / Neutral 5, which is typically consistent with an advancing tape.
Against that, the Deep Reinforcement Learning technical rank is extremely weak at #1365 out of 1426 with a Bearish label and score -0.914. This is the key reason the Overall Technical Score compresses to 0.153 and remains Neutral.
Interpreting the combination: the indicator set argues for constructive conditions, but the broader AI technical ranking warns that this pattern has not recently mapped to strong probabilistic outcomes versus peers. In such cases, level-based confirmation becomes more important—especially with BB Width 0.1263 (limited dispersion) and a bearish Vol ROC(20) -18.5 that can undermine breakouts if participation does not improve.
6) News sentiment + extractive gist
Sentiment score (avg): 0.070 | Positive: 33% | Neutral: 67% | Negative: 0%
KGNAI AI News Sentiment Score (normalized -1 to +1): 0.30 (as of 2026-02-20) | Label: Bullish | Overall news score: 0.48
Positive Developments
Recent coverage across major financial outlets indicates a mildly constructive narrative backdrop for Novartis. The aggregate tone is supported by a normalized news sentiment score of 0.30 and an overall news score of 0.48, with the distribution showing 33% positive, 67% neutral, and 0% negative. The constructive angle largely reflects continued attention on company updates and market framing around the stock’s recent strength, which can reinforce investor focus during technically defined periods near resistance (125.9400). From a positioning lens, positive news bias can help maintain momentum conditions already visible in the technical dashboard (e.g., MACD hist 0.2421, RSI(14) 81.59)—not as a driver on its own, but as a stabilizer when the market is deciding whether a range resolves higher.
Neutral / Mixed Developments
The majority of items are informational rather than directional, consistent with the average sentiment score of 0.070 and the high 67% neutral share. This neutrality aligns with KGNAI’s broader read-through: ranks are Neutral across timeframes (e.g., Daily #405, Weekly #876, Monthly #991), and the Overall Technical Score also sits Neutral (0.153) despite a bullish 18-signal layer. In this mix, news tends to function as context for volatility and risk appetite rather than as a catalyst. The practical implication is to keep decision-making anchored on the map: 108.8833 as the deterioration line and 125.9400 as the continuation gate.
Negative / Risk Signals
While the explicit negative share is 0% in the provided distribution, the risk framing is still relevant because sentiment can lag market structure. With RSI(14) at 81.59 and volatility relatively contained (Bandwidth 0.1263), the market can react asymmetrically if expectations become crowded near resistance. Additionally, the technical stack contains an internal caution flag: the DRL technical rank is #1365/1426 with a Bearish label, and Vol ROC(20) is -18.5, which can be consistent with waning participation. In that environment, a “good news / weak follow-through” tape can still produce consolidation or pullback. The clean risk line remains the same: a close below 108.8833 shifts the evidence toward deterioration.
- Whether price acceptance develops above 125.9400 alongside improving participation (watch alignment with Vol ROC(20) -18.5).
- Any momentum cooling signal (e.g., MACD hist 0.2421 fading) while RSI(14) 81.59 remains elevated.
- Risk control if price closes below 108.8833, which the scenario framework treats as deterioration.
Sources referenced: Reuters, Bloomberg, Yahoo Finance, MarketWatch, Investing.com
Snapshot: AI Rank (Short–Mid–Long): Neutral (Neutral–Neutral–Neutral) · Technical Confluence: Bullish · Key Levels: Support ~108.88 | Resistance ~125.94 · News Sentiment: Neutral
7) Sources
Not available in the provided data.
You may also like: How KGNAI AI ranks instruments across global markets
Disclaimer: KGNAI provides AI-generated analytics and educational market commentary only. This is not financial advice. Markets involve risk. Always do your own research.