
TPFG.LSE — Property Franchise Group PLC (UK) | 08-Mar-2026 | Mid-term ranks constructive, near-term technicals still heavy
Property Franchise Group PLC (TPFG.LSE) presents a split-profile setup: KGNAI’s cross-sectional ranks are constructive in the medium to longer horizon (with the Monthly rank at #29 and 3-Monthly at #25 out of 1425), while short-horizon positioning remains more tentative (Daily #768, Weekly #352). On the chart, the trend filter is still challenged with Close vs MA50 = Bearish and MA50 vs MA200 = Bearish, consistent with momentum pressure (RSI(14) 14.54, MACD histogram -0.4340). Volatility conditions appear comparatively contained via Bollinger bandwidth (0.1519), which often coincides with tighter decision windows around defined levels. Key reference zones remain Support ~ 440.0000 and Resistance ~ 514.0000. News sentiment data is sparse at the instrument level; broader coverage registers a neutral distribution (88% Neutral) while the normalized KGNAI news score is 1.00 (Bullish, dated 2026-01-20), creating a meaningful context-versus-price tension.
- Rank stance (Short / Mid / Long): Neutral (Daily #768; Weekly #352) / Bullish (Monthly #29; 3-Monthly #25) / Bullish (6-Monthly #86; Yearly #254)
- Technical confluence label: 18-signal confluence -0.333 (Bearish) with blended overall -0.103 (Neutral)
- Key levels: Support ~ 440.0000 | Resistance ~ 514.0000
- News sentiment bias: Distribution reads largely Neutral (88% Neutral; avg 0.000), while the normalized score is 1.00 (Bullish) as of 2026-01-20
- Confirmation / invalidation condition: A break above 514.0000 with volume supports continuation; a close below 440.0000 increases deterioration risk
KGNAI evaluates assets using large cross-sectional datasets built from millions of structured data points. Inputs incorporate fundamental metrics, technical structures, and systematically processed news sentiment. Statistical models, machine learning, and AI frameworks are used to assess relative positioning, signal alignment, and probabilistic behavior across broad universes.
- Ranks are comparative across the tracked universe, not absolute price targets.
- Confluence reflects alignment among independent signal groups.
- Support/resistance levels are probabilistic decision zones, not guarantees.
- Sentiment provides contextual bias within the broader analytical framework.
1) KGNAI AI Analysis
Region: EUROPE
Total universe size: 1425 ranked instruments
- Daily rank: #768 out of 1425 — Neutral
- Weekly rank: #352 out of 1425 — Neutral
- Monthly rank: #29 out of 1425 — Bullish
- 3-Monthly rank: #25 out of 1425 — Bullish
- 6-Monthly rank: #86 out of 1425 — Bullish
- Yearly rank: #254 out of 1425 — Bullish
The rank stack suggests a classic timeframe divergence. Short-horizon ranks sit closer to the middle of the universe (Daily #768) and upper-middle (Weekly #352), which is consistent with ongoing near-term technical stress. By contrast, the mid-term ranks move into the top decile (Monthly #29; 3-Monthly #25), and the 6-Monthly rank (#86) remains firmly constructive. The Yearly rank at #254 supports the idea that longer-horizon behavior has not fully deteriorated even if price structure is currently compressed.
This configuration is often observed when an instrument is re-rating in relative terms versus its peers while its own chart still needs repair. In that sense, the ranks are not “contradicting” the technicals so much as describing different layers: cross-sectional relative positioning can strengthen ahead of (or despite) short-term trend filters. The stated term view captures this explicitly: Short-term Neutral versus Mid-term Bullish and Long-term Bullish.
For process discipline, the practical read is to treat the mid-term ranks as a tailwind while requiring chart-based confirmation before assigning high confidence to continuation. The key is whether the technical dashboard (Section 5) and the support/resistance framework (Section 4: 440.0000 / 514.0000) begin to align with the stronger Monthly and 3-Monthly ranks.
Term view: Short-term: Neutral. Mid-term: Bullish. Long-term: Bullish.
Want the full universe and complete rank tables? Unlock full access on KGNAI: https://www.kgnai.com/pricing
2) Price & trend overview
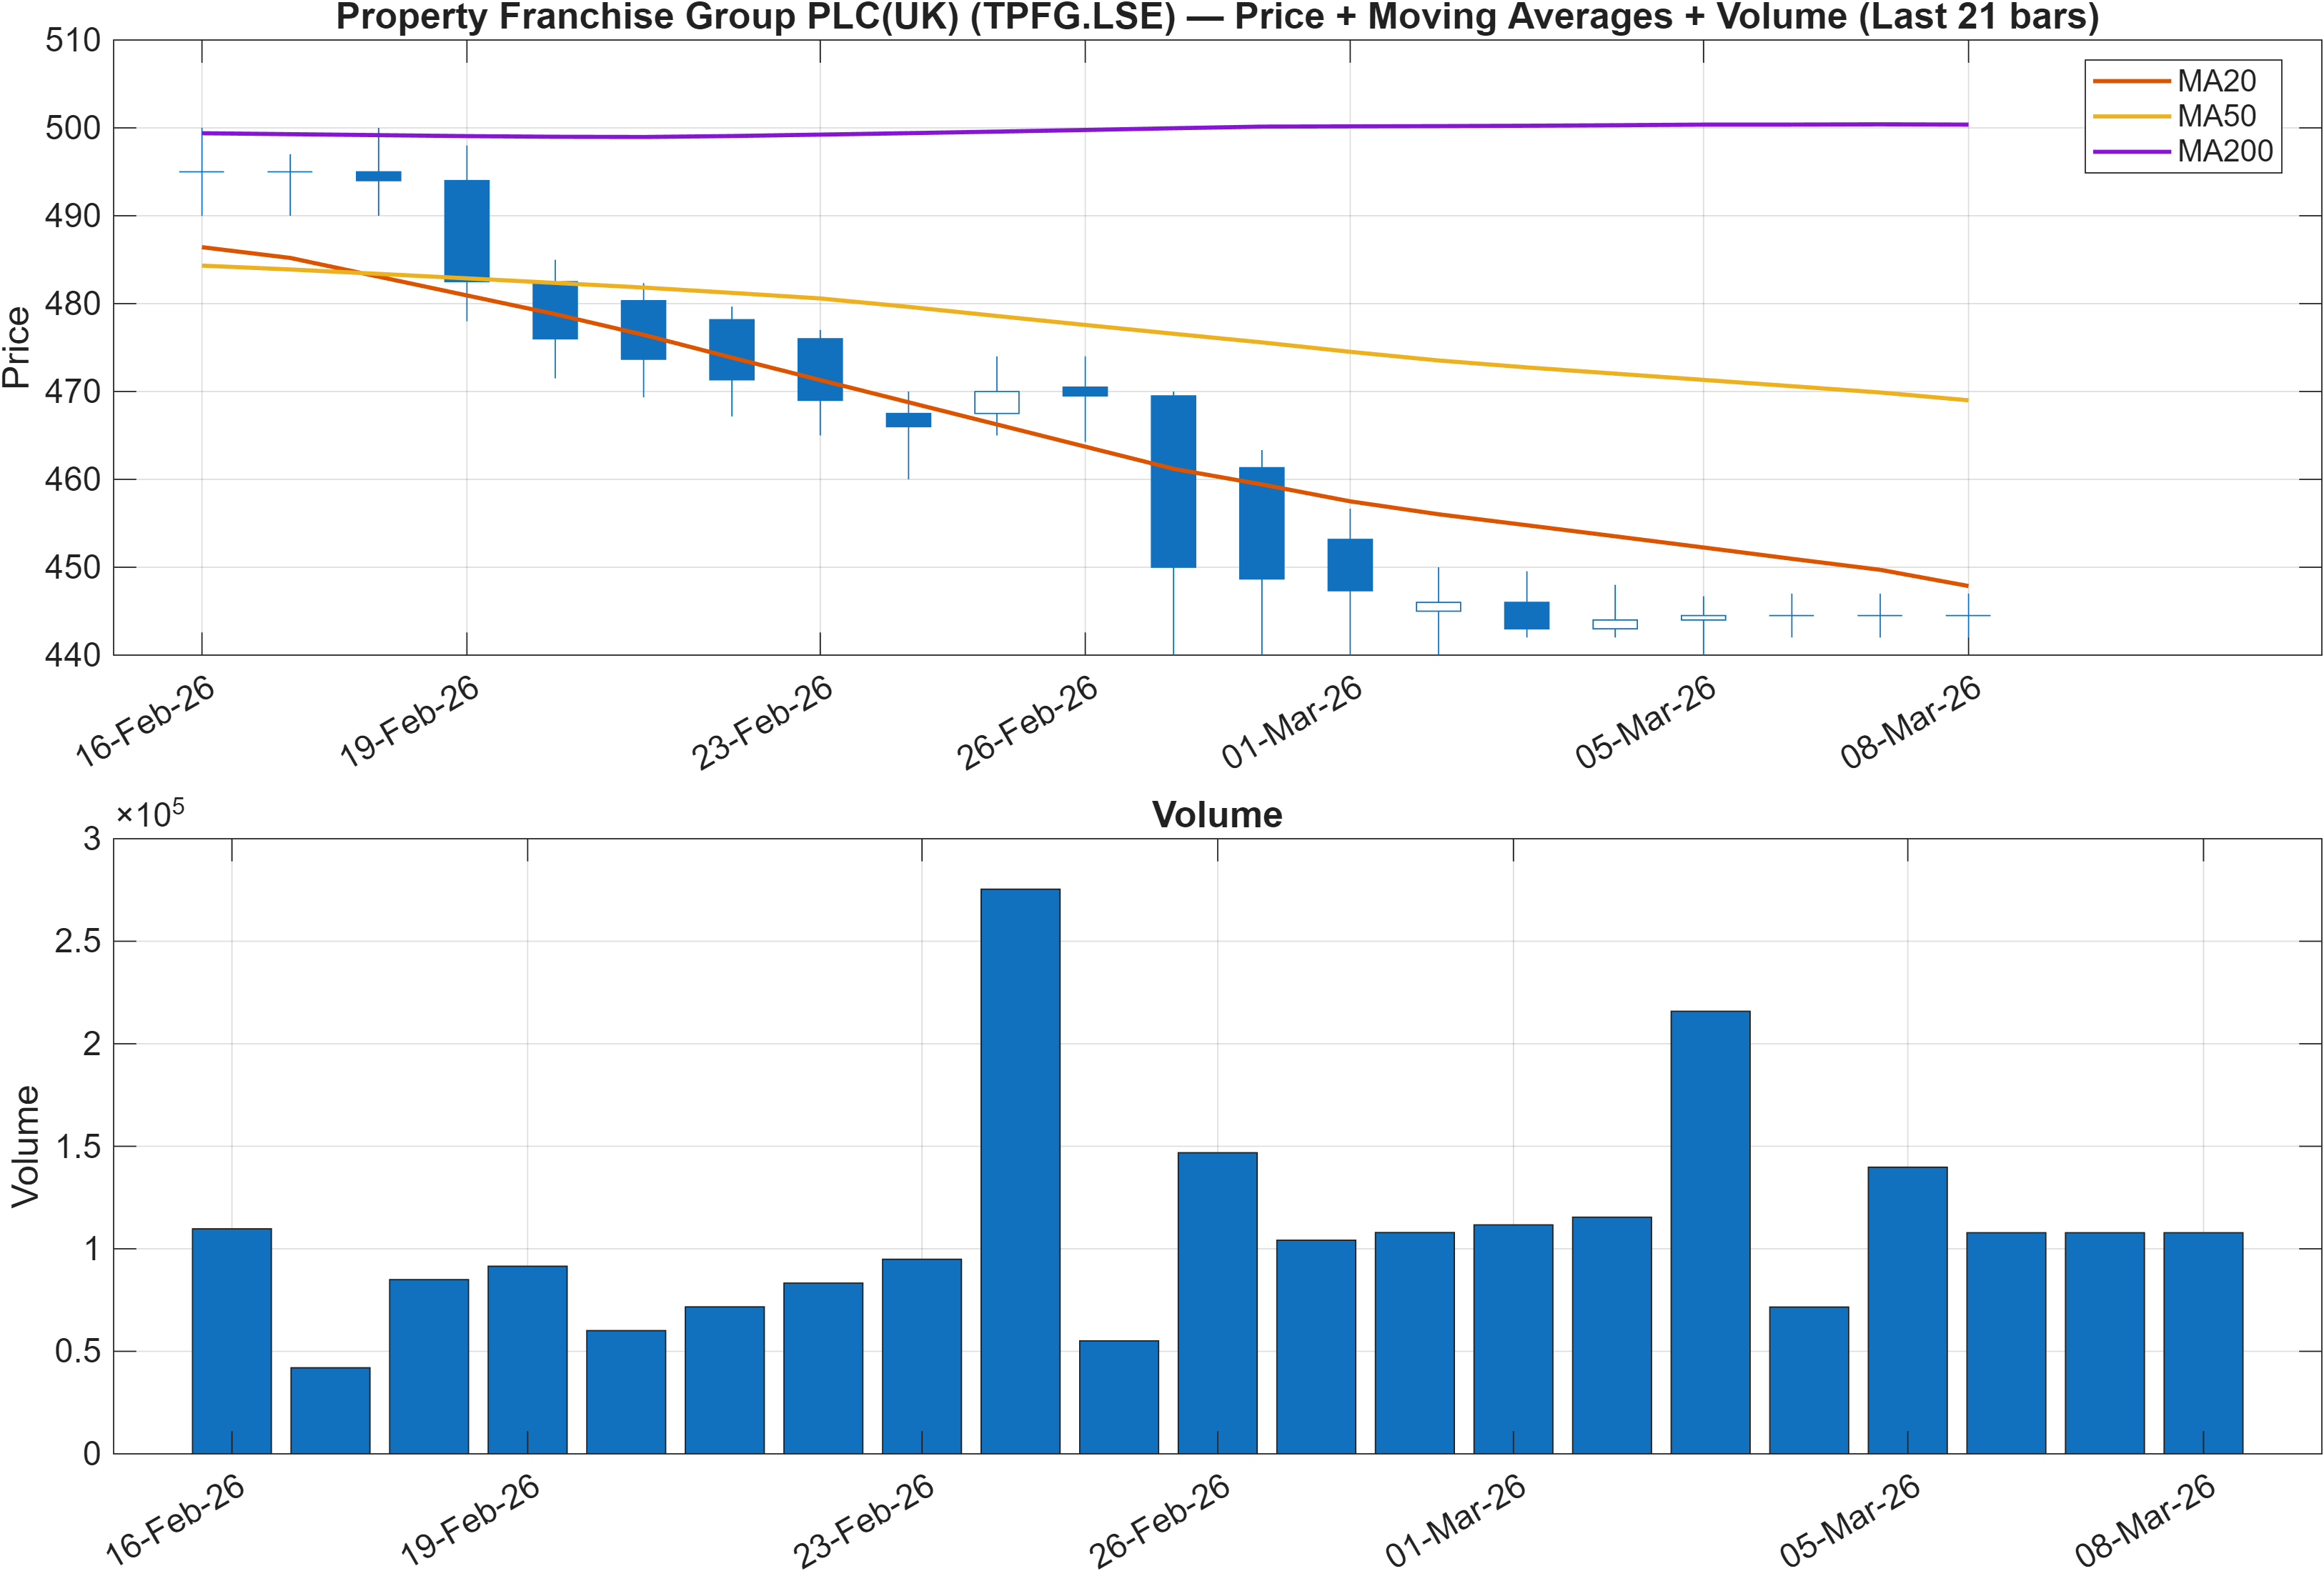
Trend filters are currently unambiguous: Close vs MA50 = Bearish and MA50 vs MA200 = Bearish. This combination typically indicates that weakness is present both in the immediate price/mean relationship and in the broader moving-average structure, aligning with a down-tilted intermediate regime. In that environment, rallies frequently face friction until the MA50 begins to flatten or reclaim, and mean-reversion bounces can be less durable without participation confirmation.
The most informative tension is that the trend view is softer than the medium-horizon KGNAI ranks (Monthly #29, 3-Monthly #25). When ranks improve while the moving-average structure remains bearish, it can imply relative stabilization versus peers rather than an absolute uptrend. That distinction matters: relative strength can be building even as the instrument remains technically “below key averages.”
Volume is best treated as the arbiter for any regime shift, particularly around the defined resistance zone at 514.0000 (Section 4). Without a clean break that holds, bearish MA alignment often keeps the market in a “sell-the-rally” microstructure. Conversely, if price begins to behave constructively near the 440.0000 support area and rebounds with improving momentum readings, it would reduce the probability that the bearish MA configuration persists.
Interpretation: Close vs MA50 = Bearish, MA50 vs MA200 = Bearish.
3) Momentum & volatility dashboard
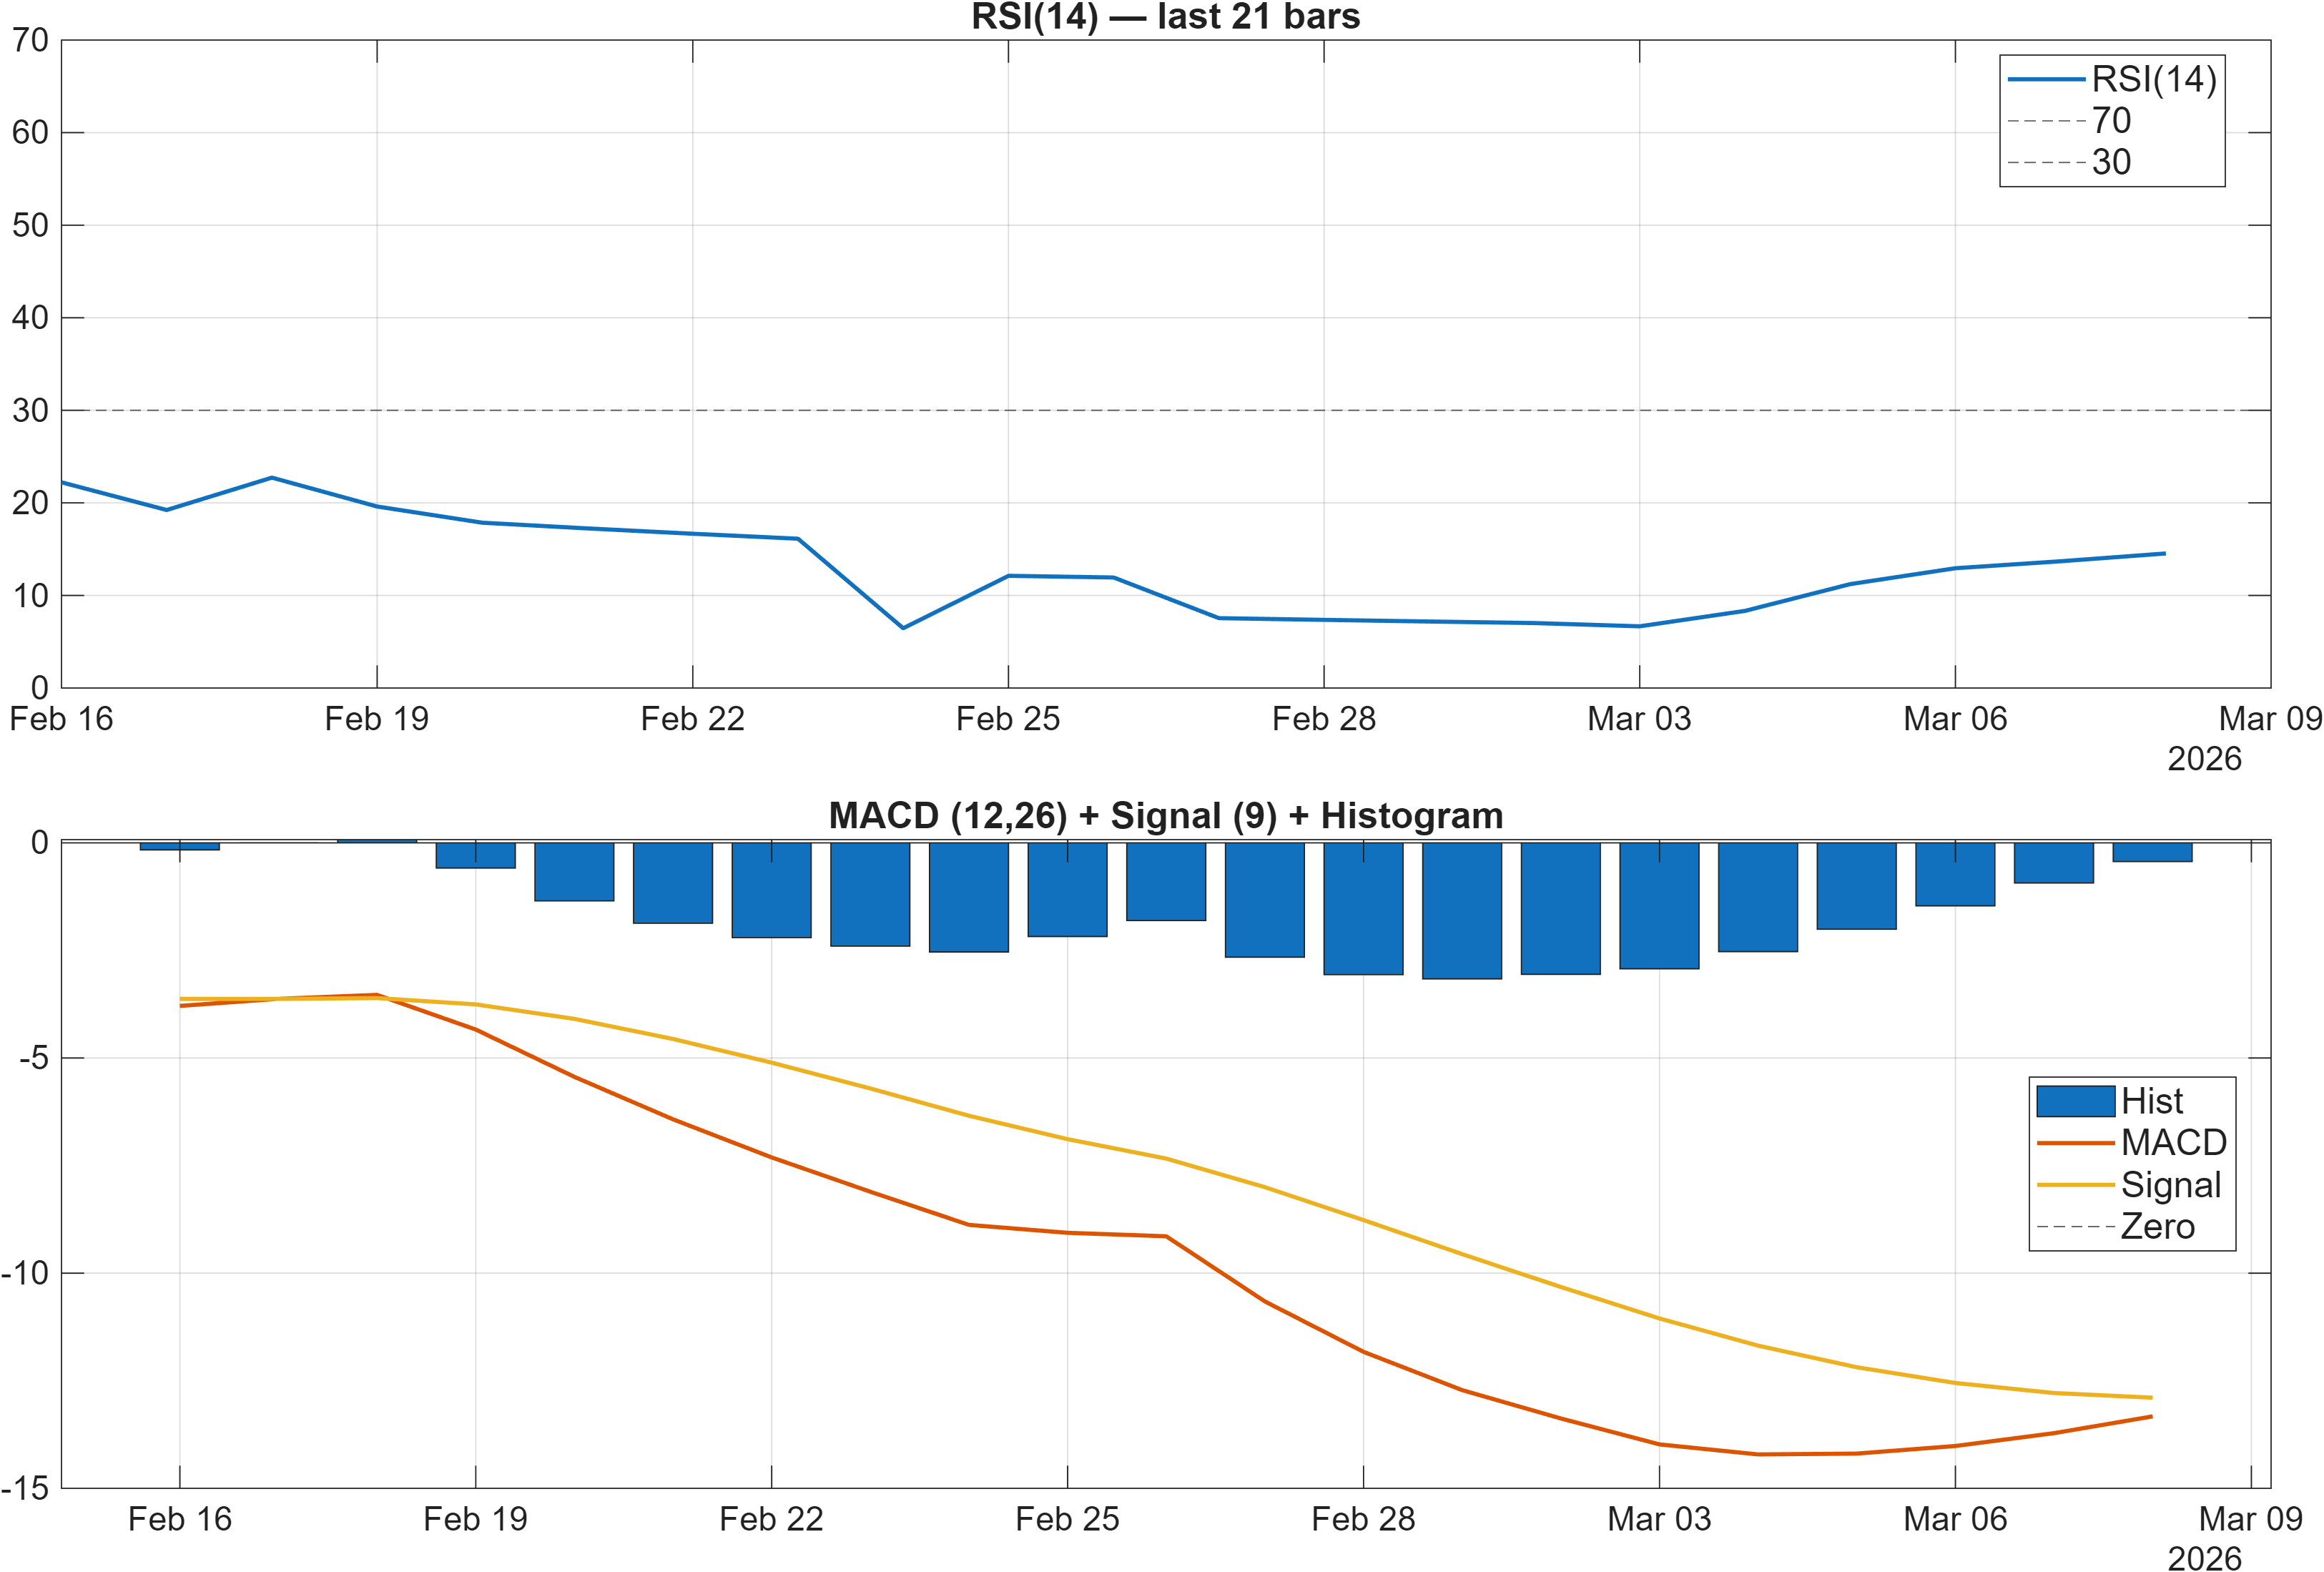
Momentum is skewed to downside pressure. RSI(14) at 14.54 sits in deeply depressed territory, consistent with the stated RSI bias = Bearish. At the same time, the MACD histogram at -0.4340 indicates negative momentum persistence rather than a clean turn. In combination, this often characterizes a market that is either in late-stage downside extension or still lacking evidence of stabilization.
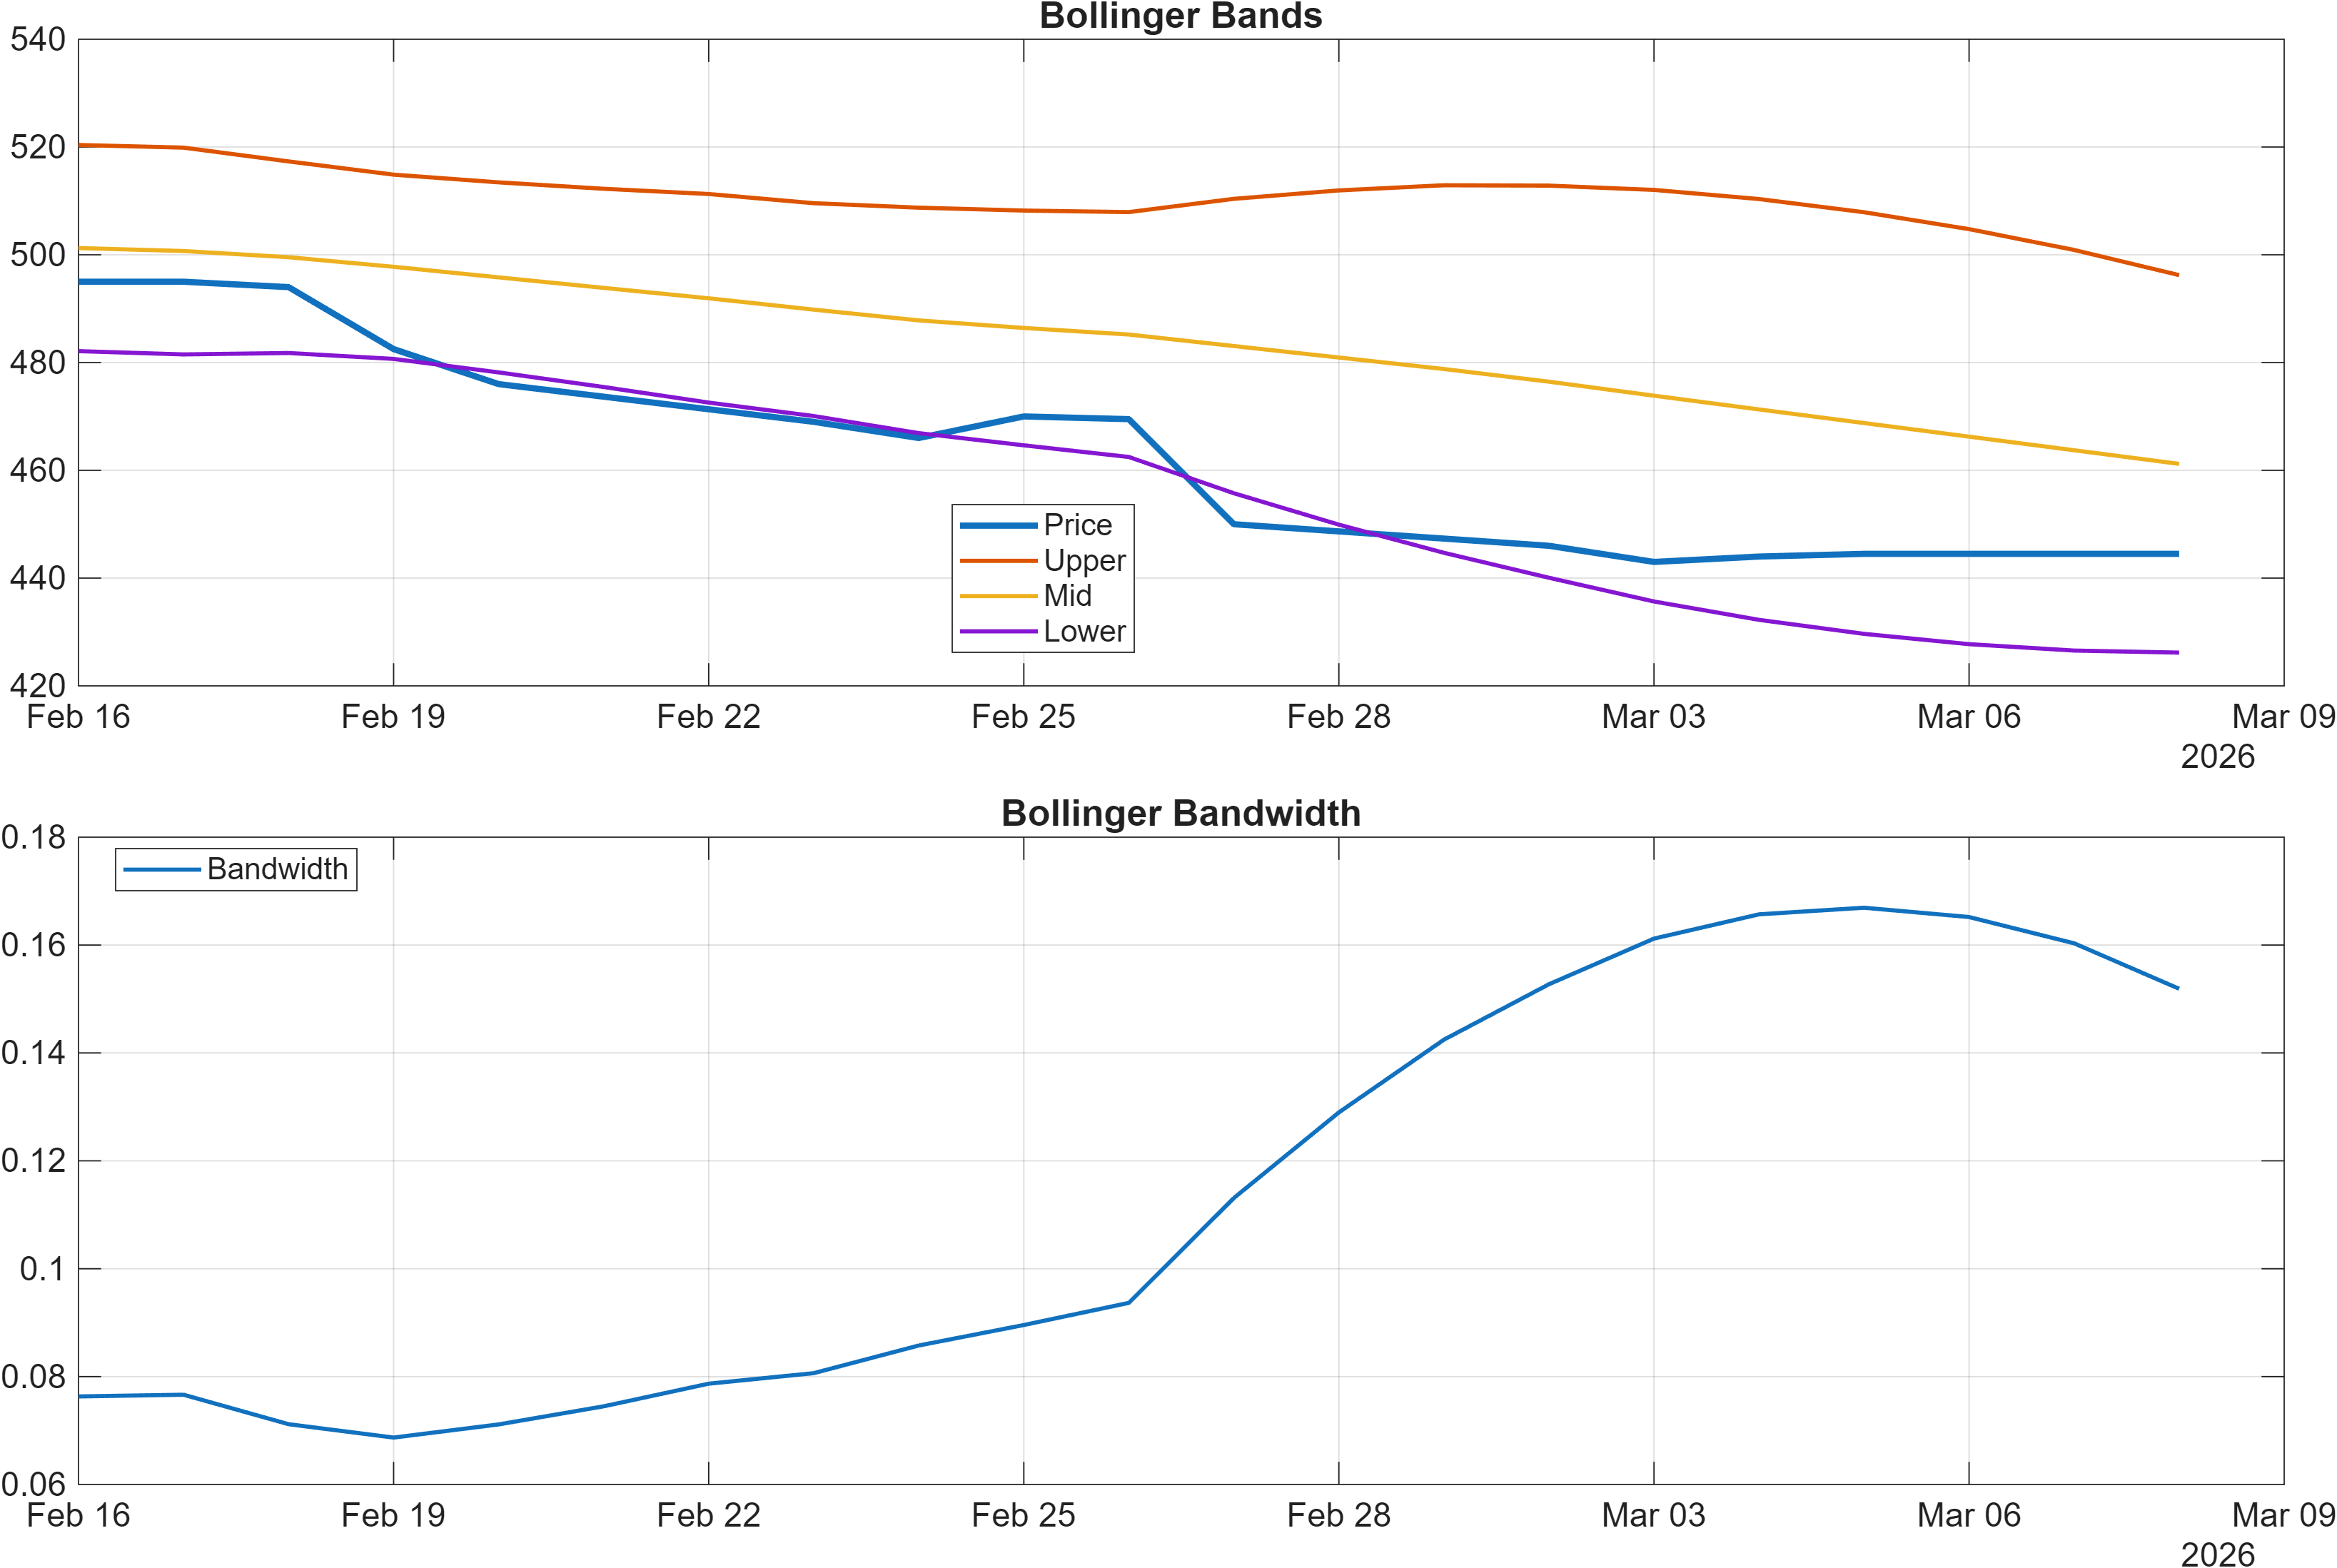
Volatility, however, does not appear to be in a broad expansion regime. Bollinger bandwidth is 0.1519, which points to comparatively compressed volatility relative to more disorderly trend breaks. This matters because compression can precede expansion, but it does not specify direction; direction is typically resolved by interaction with nearby levels (notably 440.0000 and 514.0000) and by whether momentum indicators transition from “negative and falling” to “negative but improving.”
The key analytical question is whether momentum weakness is exhaustive (potentially setting up a mean-reversion rebound) or structural (consistent with the bearish moving-average configuration). The dashboard leans toward structural weakness given the MACD histogram remaining negative alongside a bearish RSI bias. Still, the presence of volatility compression increases the sensitivity of subsequent moves: a modest catalyst can produce disproportionate price response, which is why confirmation at resistance and defense of support are the primary decision points.
Interpretation: RSI bias = Bearish, MACD hist = -0.4340.
Interpretation: Bandwidth (volatility regime) latest = 0.1519.
4) Support / Resistance zones
Support ~ 440.0000 | Resistance ~ 514.0000
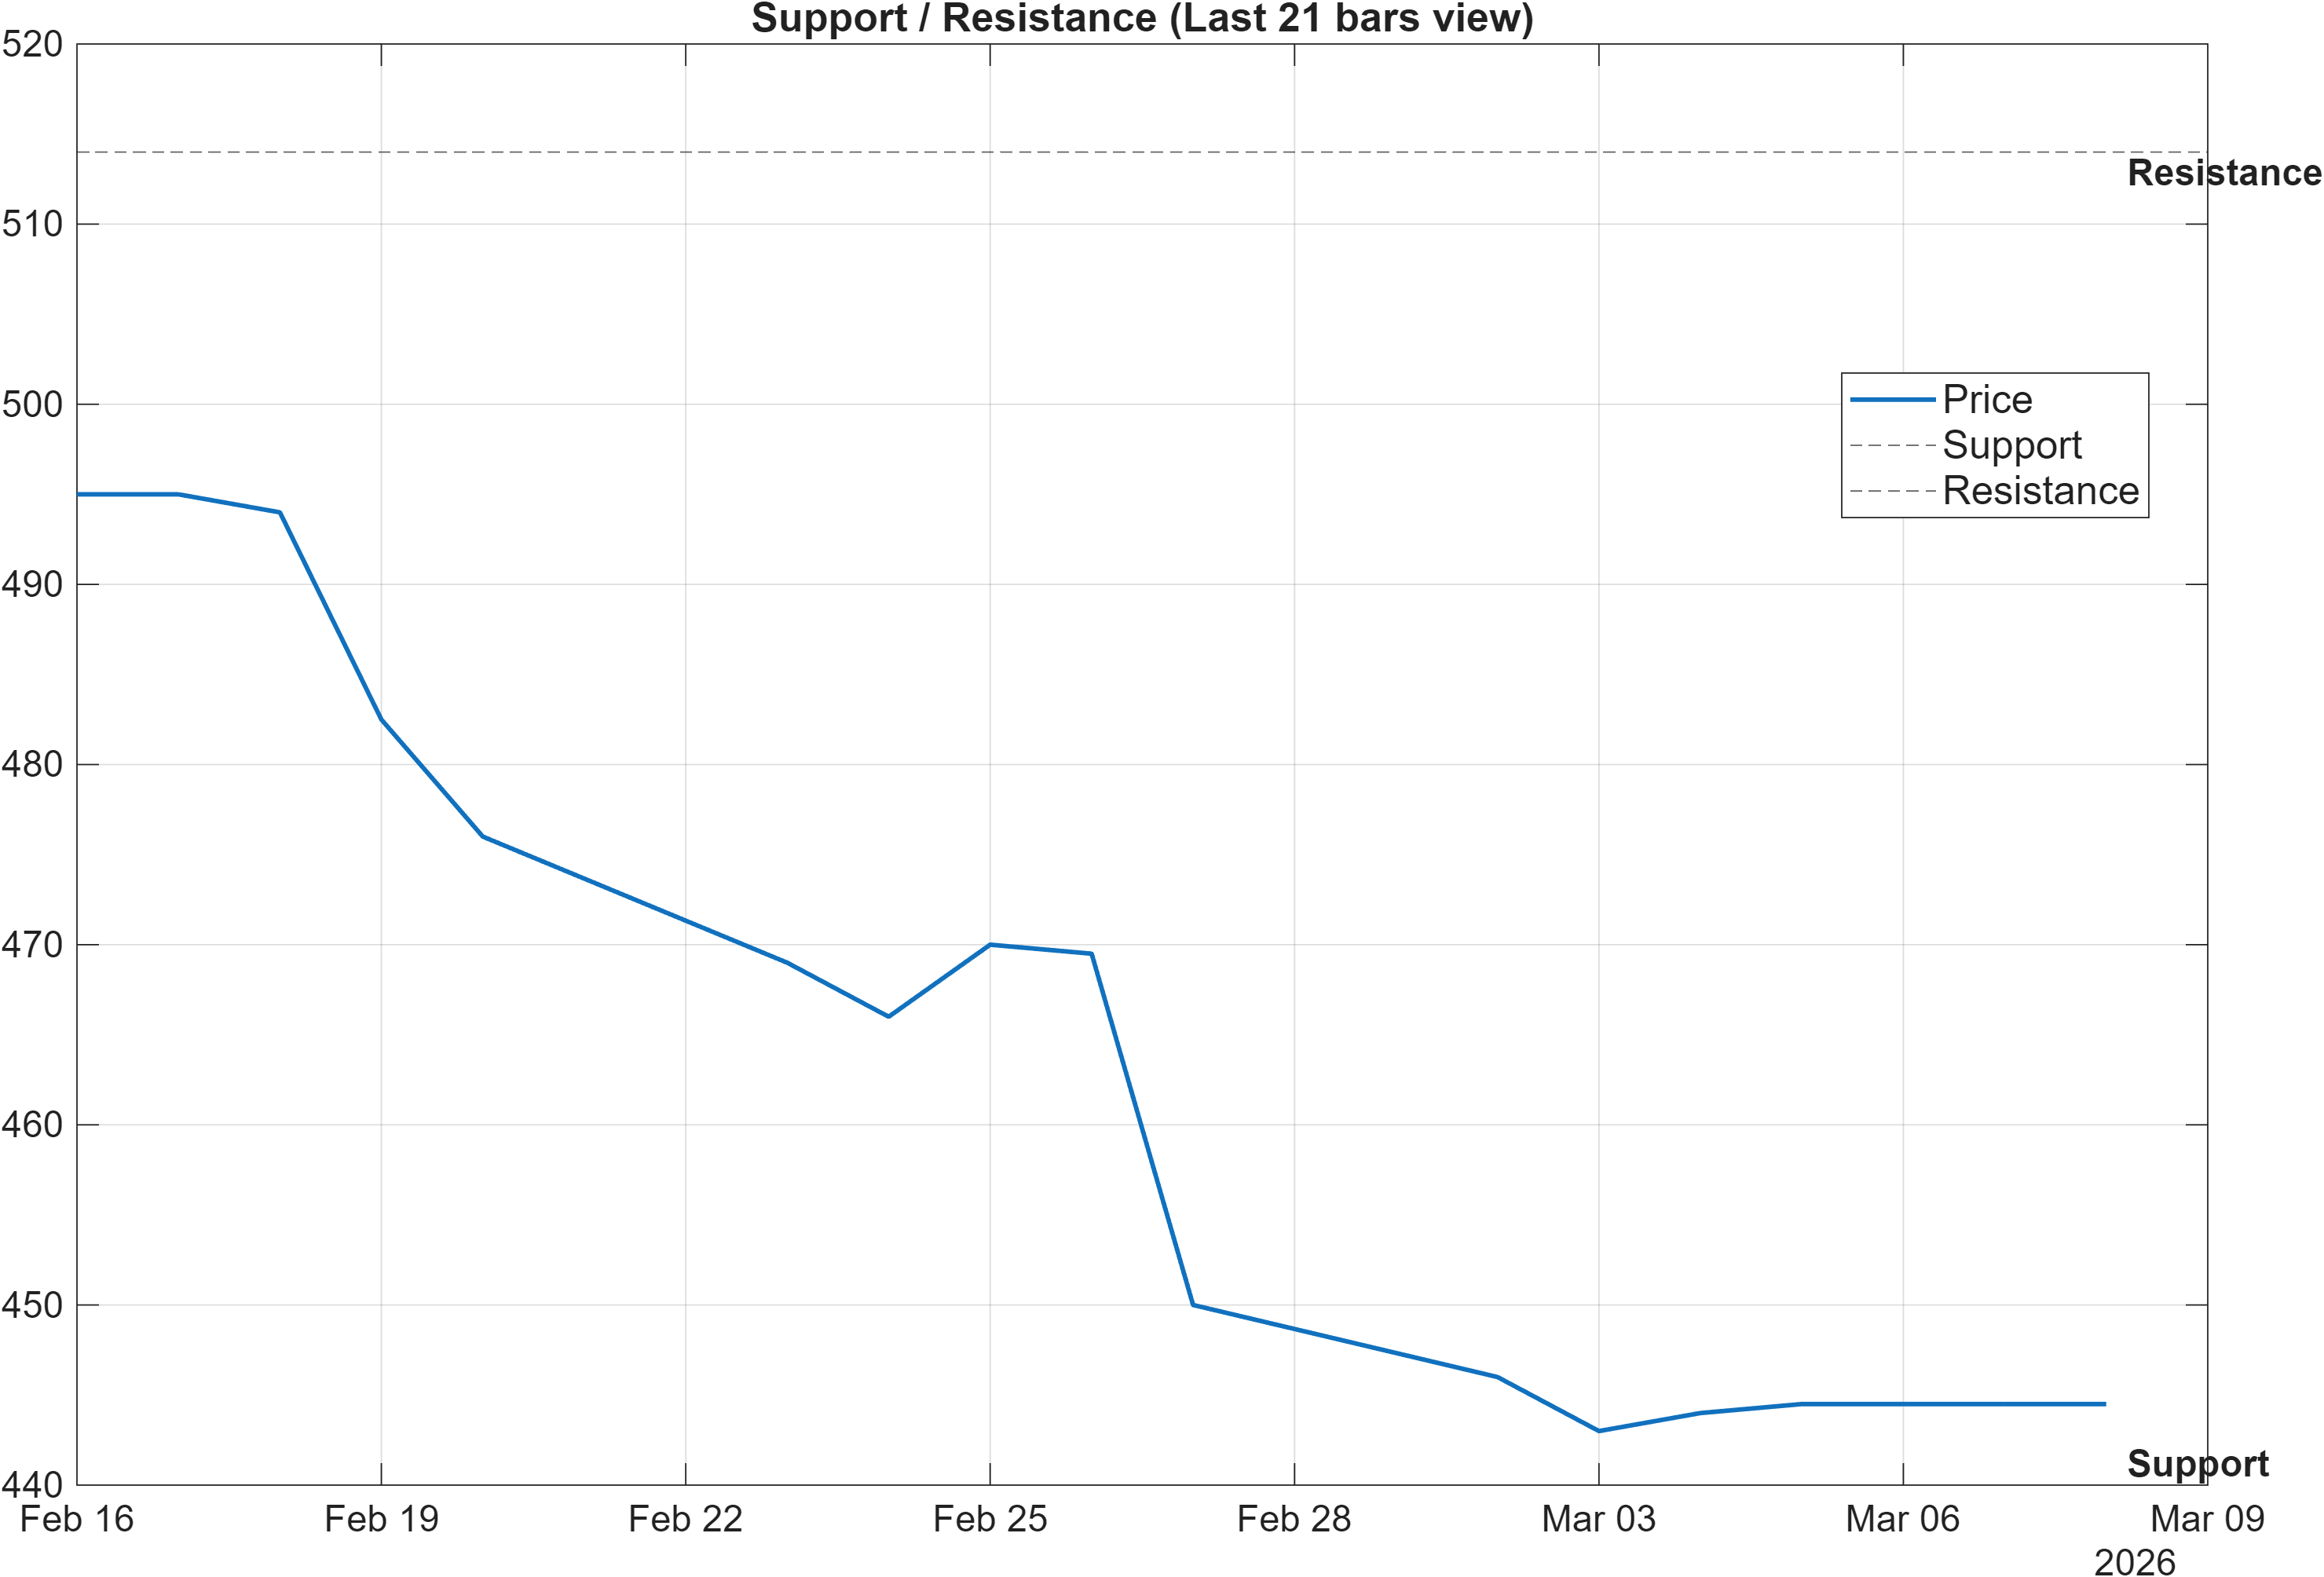
With trend filters bearish (Section 2) and momentum weak (RSI(14) 14.54; MACD histogram -0.4340), the 440.0000 support level functions as the primary “damage control” zone. A close below support, per the scenario framing, would increase signal deterioration risk—particularly because it would likely reinforce the negative momentum cluster already visible in the 18-signal dashboard.
On the upside, 514.0000 is the key level for validating that mid-term ranks (Monthly #29, 3-Monthly #25) are translating into actionable price behavior. In a bearish MA structure, resistance breaks that lack volume confirmation can fail quickly; therefore, the conditional language in the scenario view (“break above resistance with volume → continuation”) is central. It defines what “alignment” looks like: price acceptance above resistance plus evidence of participation.
The more subtle point is that this is not simply a two-level map; it is also a framework for diagnosing regime transition. If price holds above 440.0000 while volatility remains contained (bandwidth 0.1519), the market may be in consolidation rather than breakdown, even if momentum looks poor. Conversely, a break below support during a volatility expansion phase would typically indicate that compression resolved downward, consistent with the bearish confluence score of -0.333 (Section 5).
Scenario view: Break above resistance with volume → continuation. Close below support → signal deterioration risk.
5) Quant Technical Dashboard (18 Signals)
KGNAI AI Technical Analysis Score (Deep Reinforcement Learning): Rank #402 out of 1425 (Rank 1 represents the strongest technical positioning and a higher probability of favorable price behavior. As ranks increase toward the maximum, the probability of favorable outcomes weakens and bearish positioning becomes more dominant.) | Label: Neutral | Score: 0.436
18-Signal Technical Confluence Score: -0.333 (Bearish)
Overall Technical Score (18-signal confluence + DRL rank blend): -0.103 (Neutral)
Note: The blended score reflects signal strength weighted against broader AI technical ranking, which may temporarily diverge.
Blended technical score breakdown: -0.103 (Neutral | Bull 4 / Bear 10 / Neutral 4)
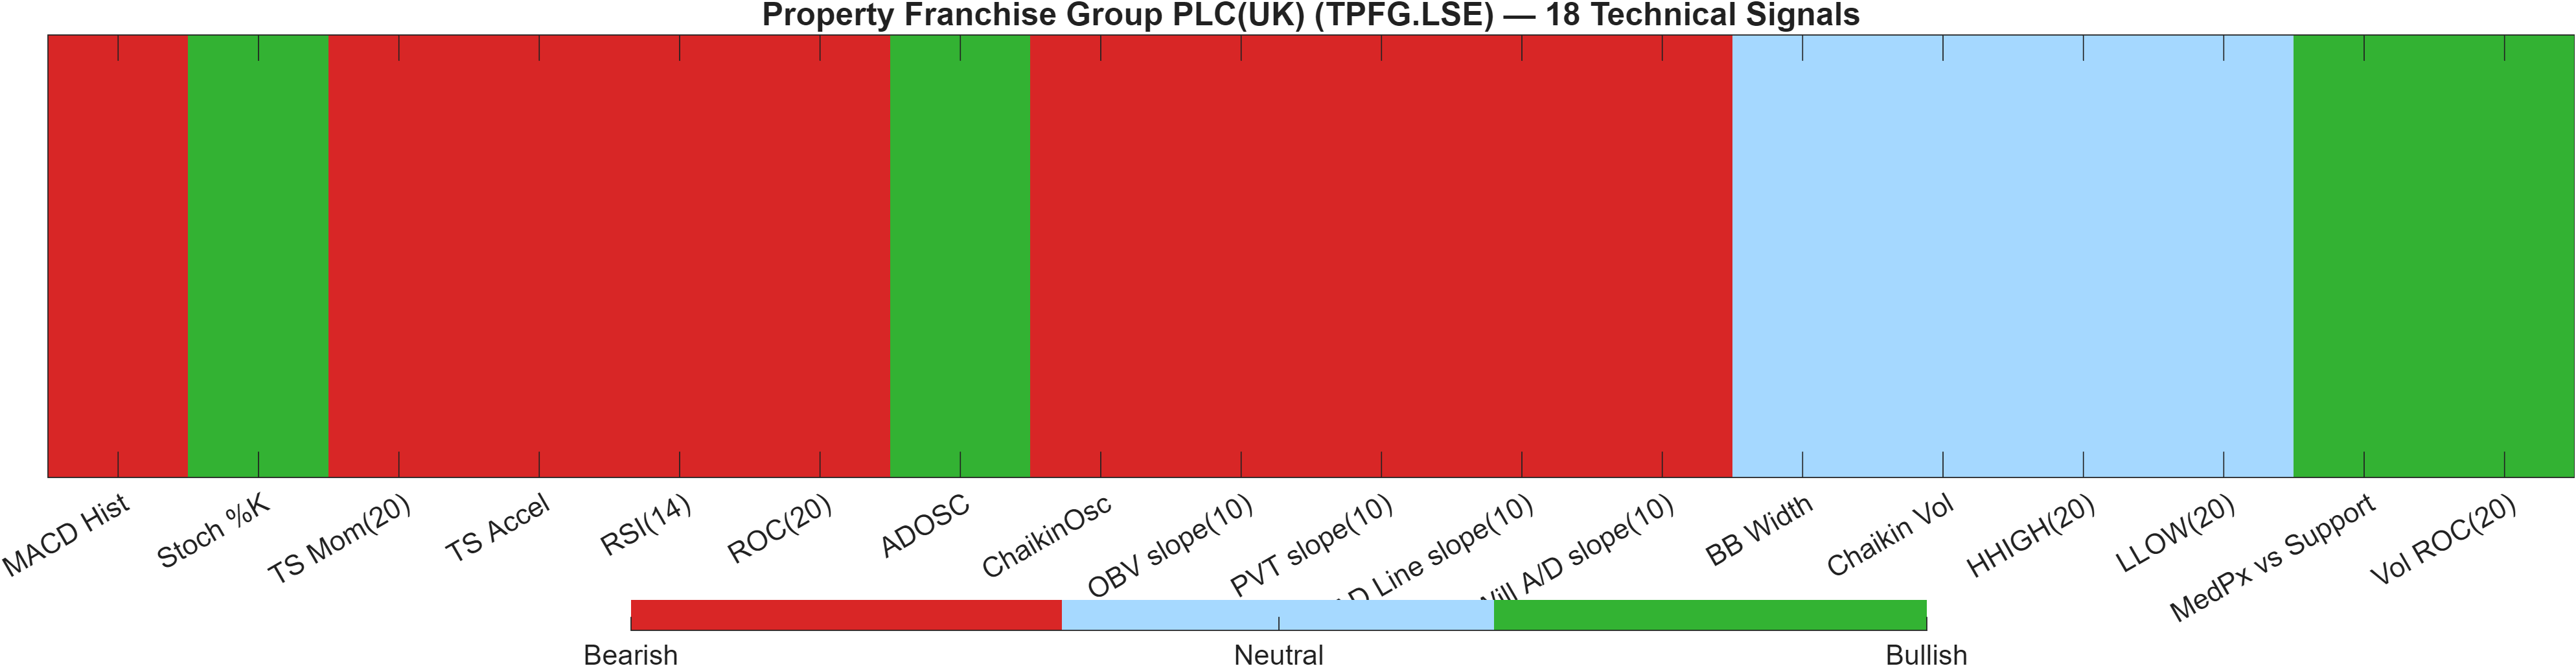
The dashboard highlights a bearish breadth outcome at the indicator layer, with the 18-signal confluence at -0.333 and a Bear/Bull/Neutral mix of 10 / 4 / 4. This aligns with the momentum picture (RSI(14) 14.54 and MACD histogram -0.4340) and the bearish moving-average structure. However, the blended overall technical score is -0.103 and labeled Neutral, reflecting a moderation effect from the separate DRL technical rank (#402 out of 1425, score 0.436).
This divergence between confluence (Bearish) and blend (Neutral) is analytically useful: it implies that while many classical indicators are positioned negatively, the broader pattern-recognition layer is not flagging an equally extreme technical disadvantage on a cross-sectional basis. In practice, such setups are often sensitive to whether weak momentum begins to recover without requiring immediate trend reversal.
At the signal level, the dashboard contains both “pressure” and “potential stabilization” components. For example, Stoch %K at 15 is labeled Bullish, while RSI remains Bearish at 14.54—a configuration that can occur when very short-cycle oscillators start turning before slower momentum measures confirm. Separately, BB Width is 0.1519 (Neutral), reinforcing that volatility is not screaming “panic,” even though directional signals are mostly negative.
Signal table (Bull/Bear/Neutral)
| Indicator | Value | Signal |
|---|---|---|
| MACD Hist | -0.434 | Bearish |
| Stoch %K | 15 | Bullish |
| TS Mom(20) | -50.5 | Bearish |
| TS Accel | -28.5 | Bearish |
| RSI(14) | 14.54 | Bearish |
| ROC(20) | -10.2 | Bearish |
| ADOSC | 50 | Bullish |
| ChaikinOsc | -4.12e+04 | Bearish |
| OBV slope(10) | -4.436e+05 | Bearish |
| PVT slope(10) | -6455 | Bearish |
| AD Line slope(10) | -1.873e+05 | Bearish |
| Will A/D slope(10) | -48.04 | Bearish |
| BB Width | 0.1519 | Neutral |
| Chaikin Vol | -43.97 | Neutral |
| HHIGH(20) | 500 | Neutral |
| LLOW(20) | 440 | Neutral |
| MedPx vs Support | 4.5 | Bullish |
| Vol ROC(20) | 157 | Bullish |
Interpretation: Indicator-level signals form the base confluence, which is then adjusted using a separate AI-driven technical ranking model. The final technical score summarizes this combined view.
6) News sentiment + extractive gist
Note: Instrument-specific news matches were not found, so the digest includes broader market/sector headlines. Links are provided for verification.
Sentiment score (avg): 0.000 | Positive: 6% | Neutral: 88% | Negative: 6%
KGNAI AI News Sentiment Score (normalized -1 to +1): 1.00 (as of 2026-01-20) | Label: Bullish | Overall news score: 1.00
Positive Developments
Recent coverage across major financial outlets indicates a constructive tilt in the sentiment model even though the distribution is predominantly neutral (88% Neutral; avg 0.000). The normalized news score is 1.00 (Bullish, dated 2026-01-20), which typically reflects that the language classification is skewed away from deterioration themes despite limited instrument-specific matches. For TPFG.LSE, the analytical use of this block is contextual: it can act as a stabilizer when technicals are stressed (RSI(14) 14.54; confluence -0.333). A bullish-labeled sentiment input does not override price, but it can help explain why cross-sectional ranks remain strong at medium horizons (Monthly #29; 3-Monthly #25) even while the near-term chart is still repairing.
Neutral / Mixed Developments
The news mix captured here is explicitly described as broader market/sector coverage rather than TPFG.LSE-specific reporting, which limits signal specificity. That aligns with the sentiment breakdown: only 6% Positive and 6% Negative, with the majority classified as Neutral. In this setting, the sentiment input should be treated as a background regime indicator rather than a catalyst signal. If price remains below key trend filters (Close vs MA50 = Bearish; MA50 vs MA200 = Bearish), neutral-dominant sentiment typically implies that technical levels—440.0000 support and 514.0000 resistance—carry more immediate decision weight than narrative flow.
Negative / Risk Signals
Even with a Bullish normalized score (1.00), risk cannot be dismissed because the price-based system is currently fragile: momentum is negative (MACD histogram -0.4340) and the 18-signal layer is net bearish (-0.333). In such environments, broader geopolitical or macro headlines can operate as volatility triggers, particularly when Bollinger bandwidth is relatively contained (0.1519) and a breakout/breakdown can develop quickly. The principal risk expression in this report remains technical: a close below 440.0000 increases deterioration risk regardless of sentiment classification, while a failed move at 514.0000 can prolong the bearish MA structure and keep rallies corrective.
- Whether price can reclaim 514.0000 with volume (continuation condition).
- Whether 440.0000 holds on closing basis (deterioration risk line).
- Whether momentum improves while MACD histogram remains negative (stabilization vs renewed downside).
Snapshot: AI Rank (Short–Mid–Long): Mixed (Bullish tilt) (Neutral–Bullish–Bullish) · Technical Confluence: Bearish · Key Levels: Support ~440.00 | Resistance ~514.00 · News Sentiment: Neutral
Sources referenced: Reuters, Bloomberg, Yahoo Finance, MarketWatch, Investing.com
7) Sources
- Trump hits out at Starmer over UK reluctance to support Iran attacks — https://www.ft.com/content/0b7b81e2-6b0c-4e3c-81cb-0d6f3fd60682
- Iran warns it will hit US bases across region hours after president’s apology — https://www.ft.com/content/7c6ee5e8-c379-40c0-9d9f-d1ecc7b69261
- The bombing of Tehran — in maps and satellite images — https://www.ft.com/content/59cfcbfb-34e2-4d26-b687-5d768dcc5650
- Trump’s war on Iran is spreading. Where does it stop? — https://www.ft.com/content/ddb4a3fd-2f99-43a4-8ae6-330c6d29c14a
- The war of unintended consequences — https://www.ft.com/content/0b16e3e8-d52b-4b87-a212-bba90af39ceb
- We’ll always have Dubai — https://www.ft.com/content/fa5caf43-0ad4-4da2-a6fc-d2575bea4f41
- US faced with few good options to tamp down surging oil prices — https://www.ft.com/content/5bd03549-22b2-4d7a-a6d6-44a9aa5c3842
- A week of war in charts: the impact on the US — https://www.ft.com/content/7ec4acb7-8c49-4da5-a7f3-83410e873e5a
You may also like: How KGNAI AI ranks instruments across global markets
Disclaimer: KGNAI provides AI-generated analytics and educational market commentary only. This is not financial advice. Markets involve risk. Always do your own research.